

Who this is for: Accountants who want a trend view across a company’s finalized reports.
What you’ll learn: How to open the Reports Dashboard and read its trends.
Before you begin #
- The dashboard aggregates a company’s finalized reports, so finalize a few reports first.
Step-by-step instructions #
Step 1: Switch to the Dashboard #
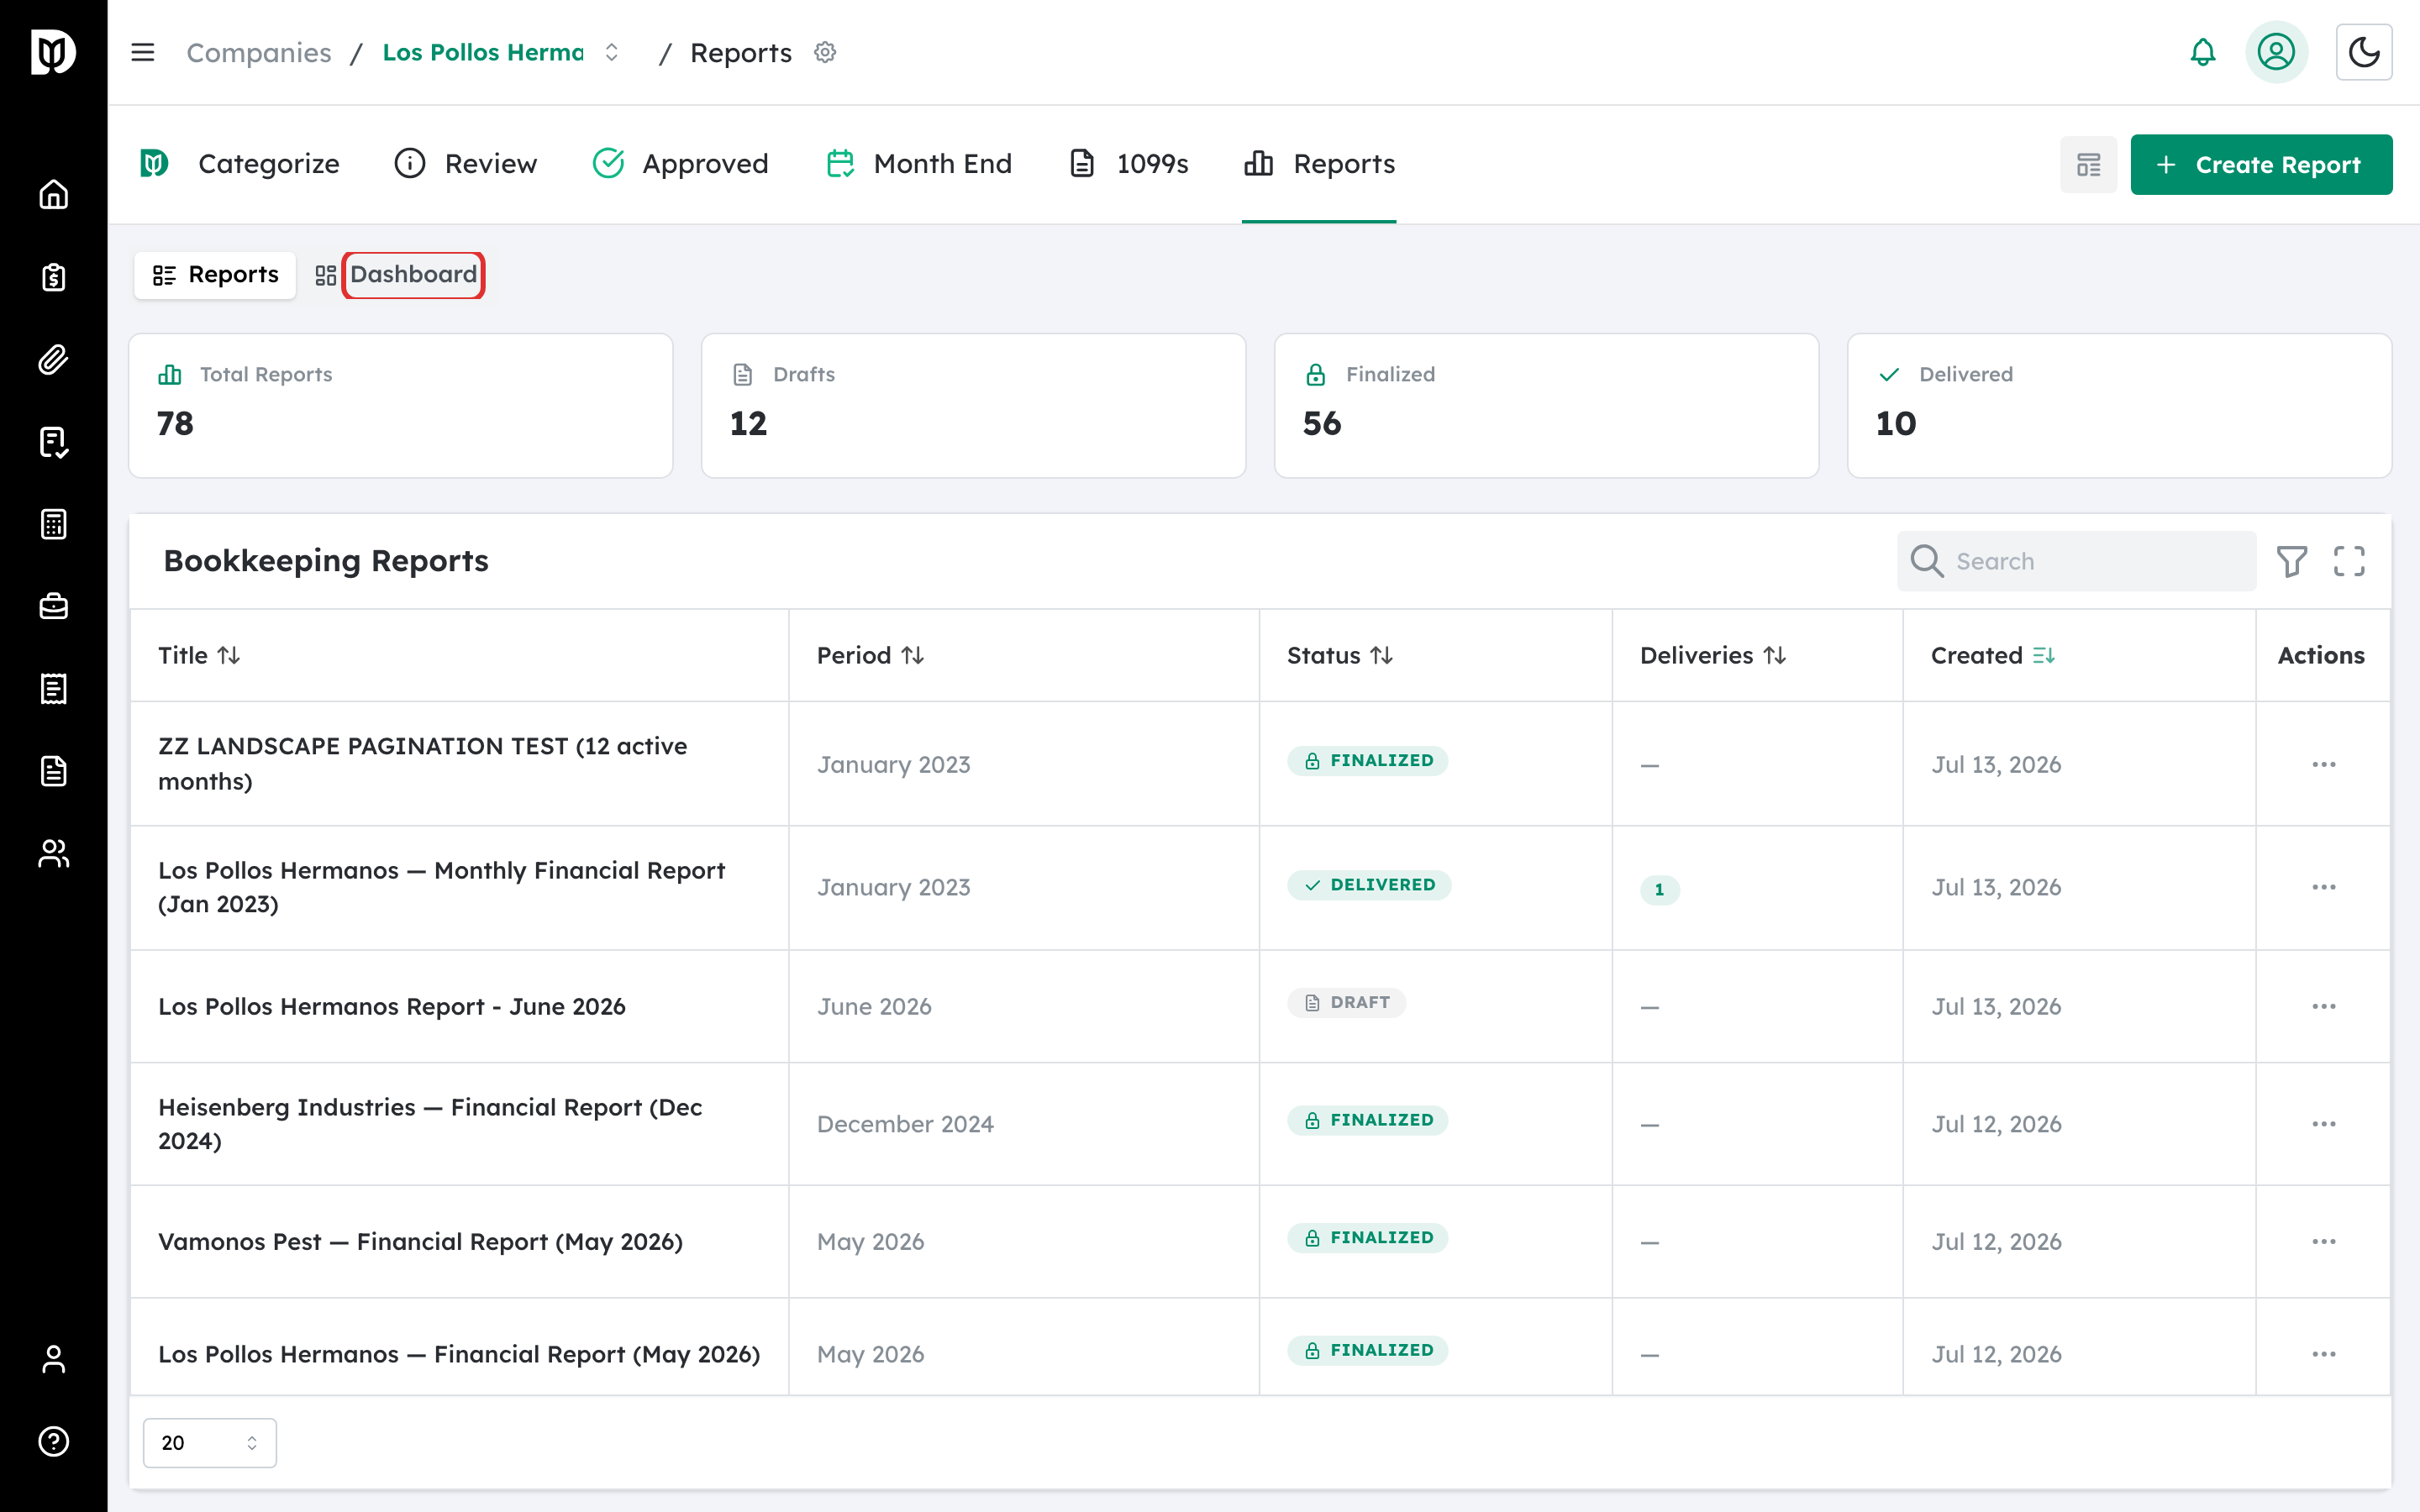
In the Reports workspace, select the Dashboard toggle.
Step 2: Read the trends #
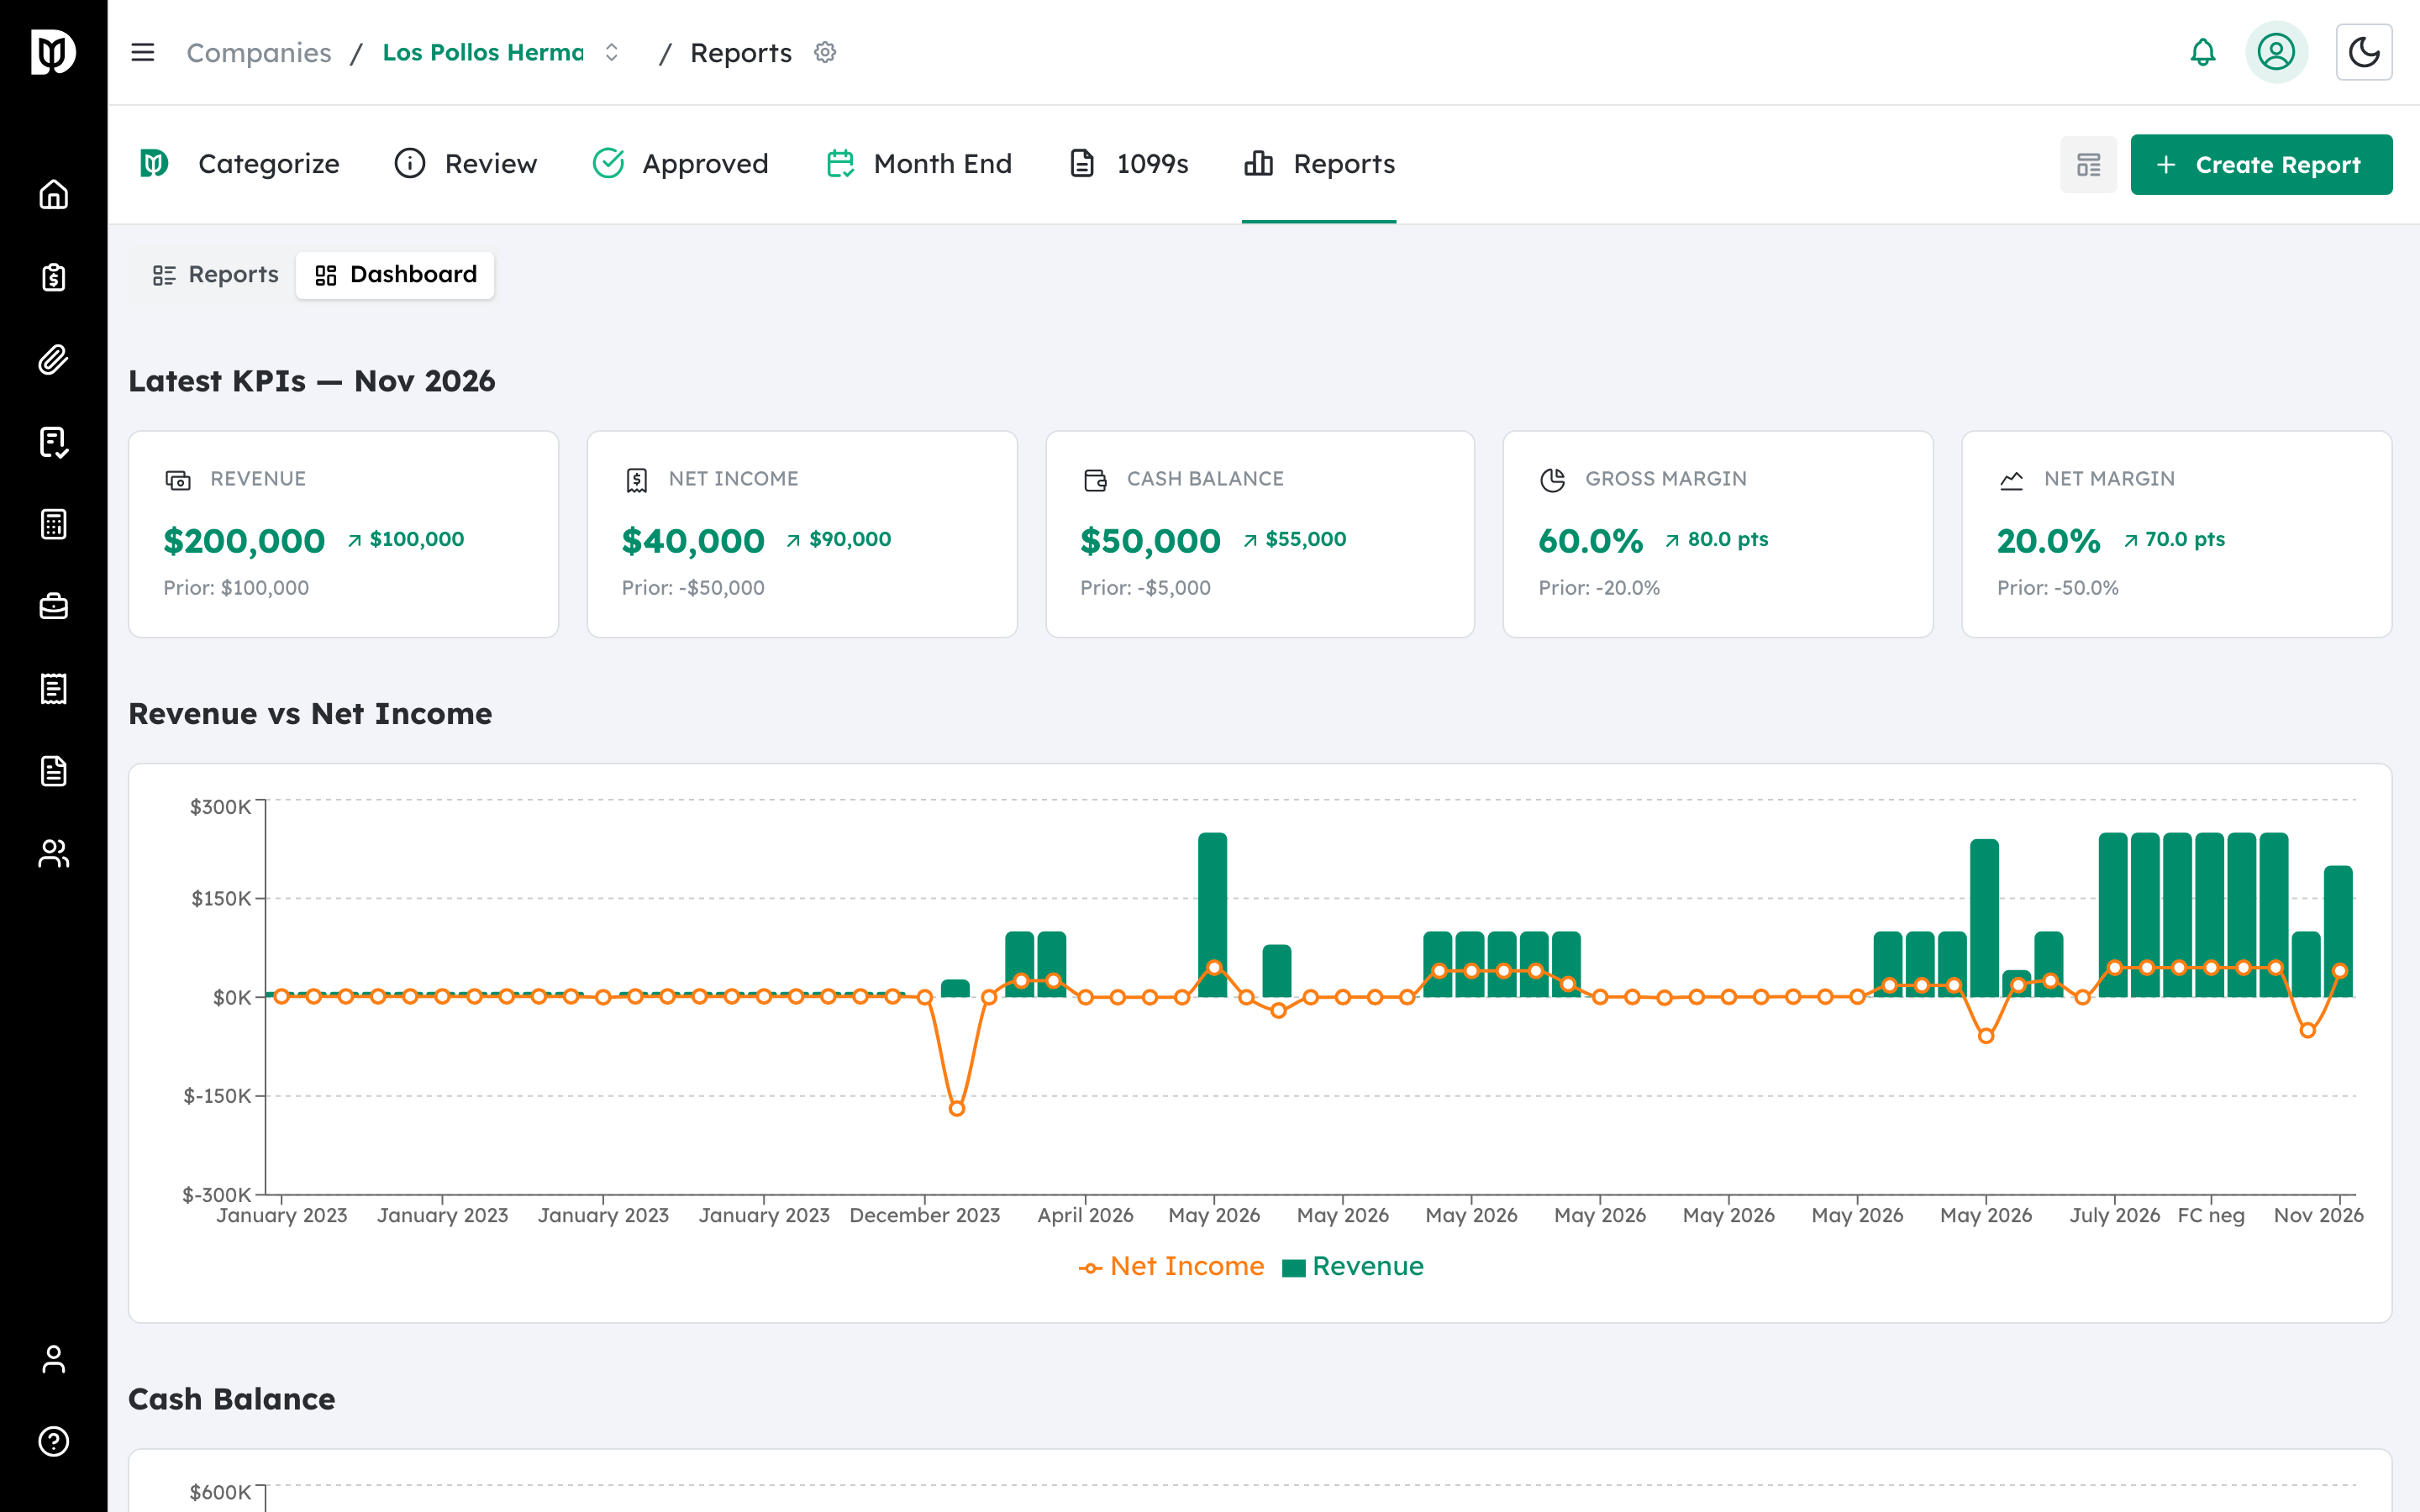
The dashboard shows the latest KPIs and charts for Revenue vs Net Income, Cash Balance, and gross and net margins over time, drawn from the company’s finalized reports.
What happens next #
Use the dashboard to spot trends before your next client meeting and decide which reports to prepare.
Troubleshooting #
- Problem: The dashboard is empty. Finalize at least one report for the company — drafts aren’t included.


