Who this is for: Accountants who have completed an RC survey and want to review the results or export the report as a PDF.
What you’ll learn: How to interpret every section of the Reasonable Compensation Report and how to download it as a PDF.
Before you begin #
- You need a completed RC survey. If you have not created one yet, see How to Create a Reasonable Compensation Survey.
- The survey must have a status of Completed, Finalized, or Delivered to view the report.
Step-by-step instructions #
Step 1: Open the report #
From the Reasonable Compensation dashboard, click on any survey with a status of Completed, Finalized, or Delivered. You can also click the eye icon in the row’s action column. The report page loads with the title Reasonable Compensation Report and the subtitle Cost Approach (Many Hats Methodology).
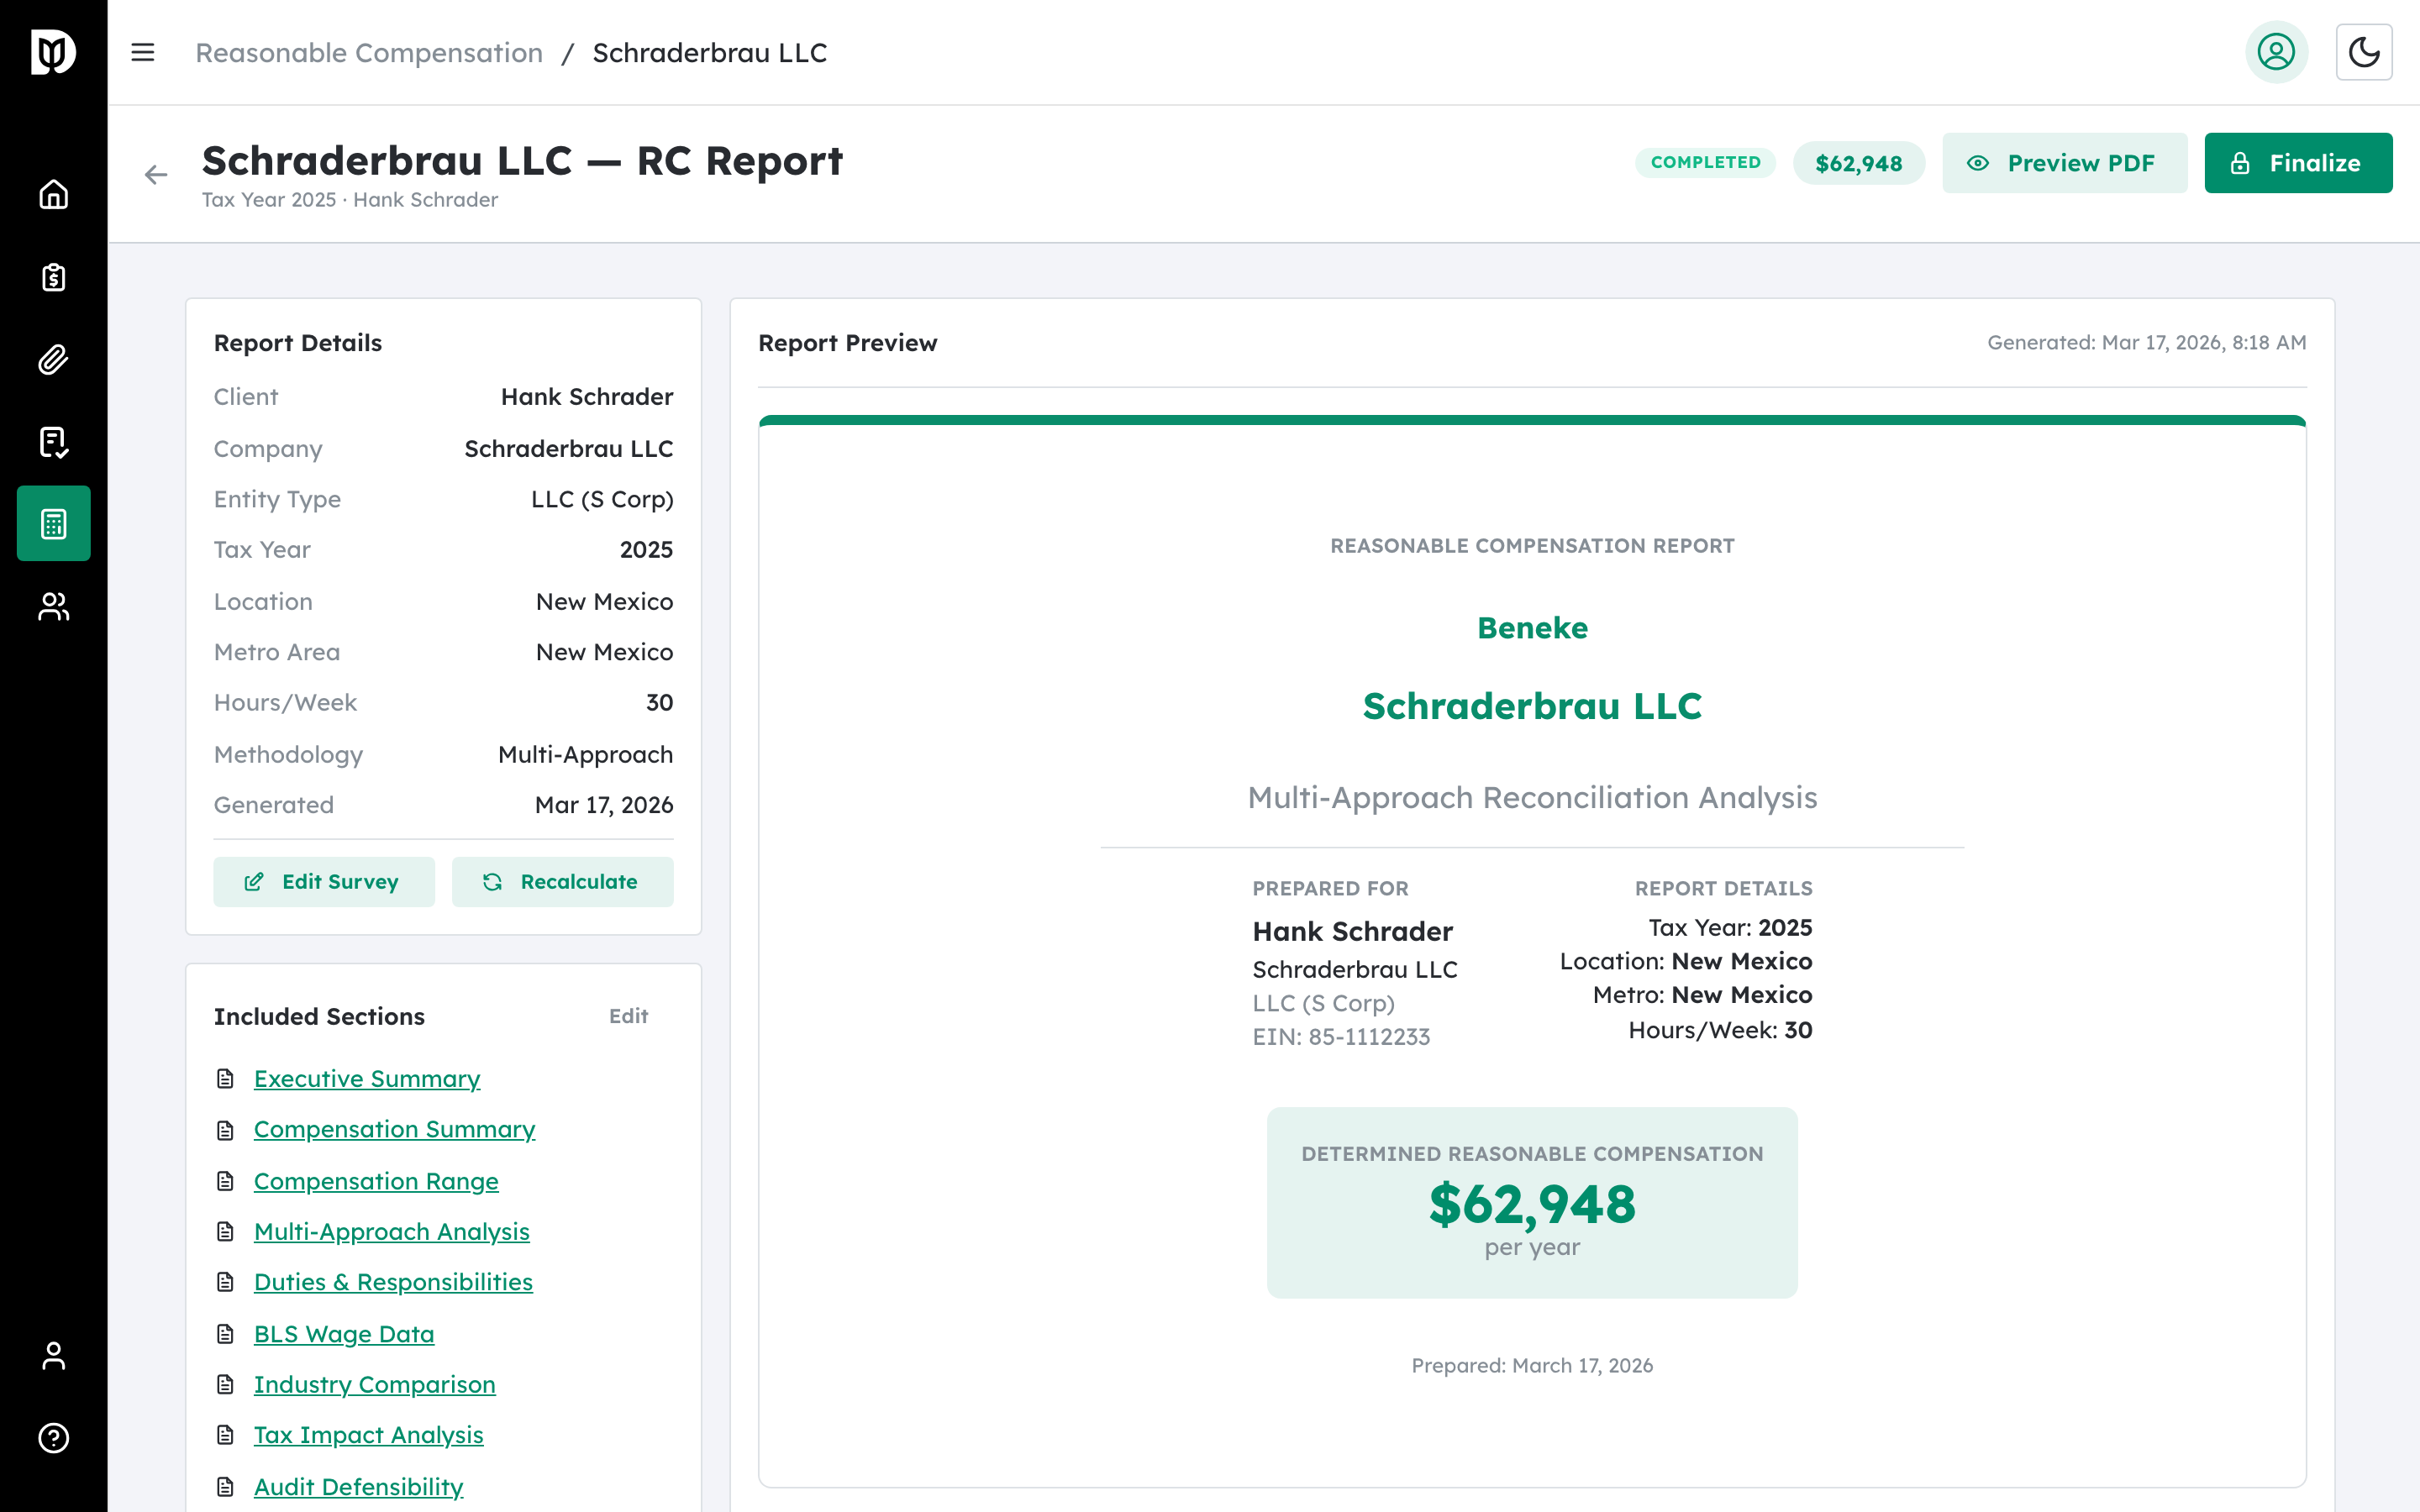
Step 2: Review the summary cards #
At the top of the report, three summary cards display the key figures:
- Total Reasonable Compensation: The total annual compensation amount, shown in green.
- Total Hours per Year: The total annual hours based on the weekly hours you entered, multiplied by 52.
- Effective Hourly Rate: The total compensation divided by total hours, representing the blended hourly rate across all roles.
Above these cards, a details section shows the client name, company name, tax year, business state, hours per week, and EIN (if provided).

Step 3: Read the Executive Summary #
The Executive Summary card contains:
- Data Quality badge: A colored badge showing overall confidence — High Confidence (green), Medium Confidence (yellow), or Low Confidence (red).
- Key Findings: A bulleted list of important observations, such as the highest-value role, work commitment level, effective hourly rate, and geographic wage adjustments.
- Compensation Rationale: A paragraph explaining why the calculated amount represents reasonable compensation.
- Data Quality Summary: Shows the number of high-confidence tasks, tasks with warnings, the oldest data year used, and an overall data quality progress bar (0 to 100%).
Step 4: Review the Industry Comparison #
The Industry Comparison card shows how the calculated compensation compares to regional and national benchmarks:
- State Median for Similar Roles: The median compensation in the business’s state for comparable positions.
- National Median for Similar Roles: The median compensation across all US states.
- Percentile Rank: Where the calculated compensation falls relative to industry data (for example, “65th percentile”).
- Comparison Notes: Additional context about the comparison, displayed in a blue information box.
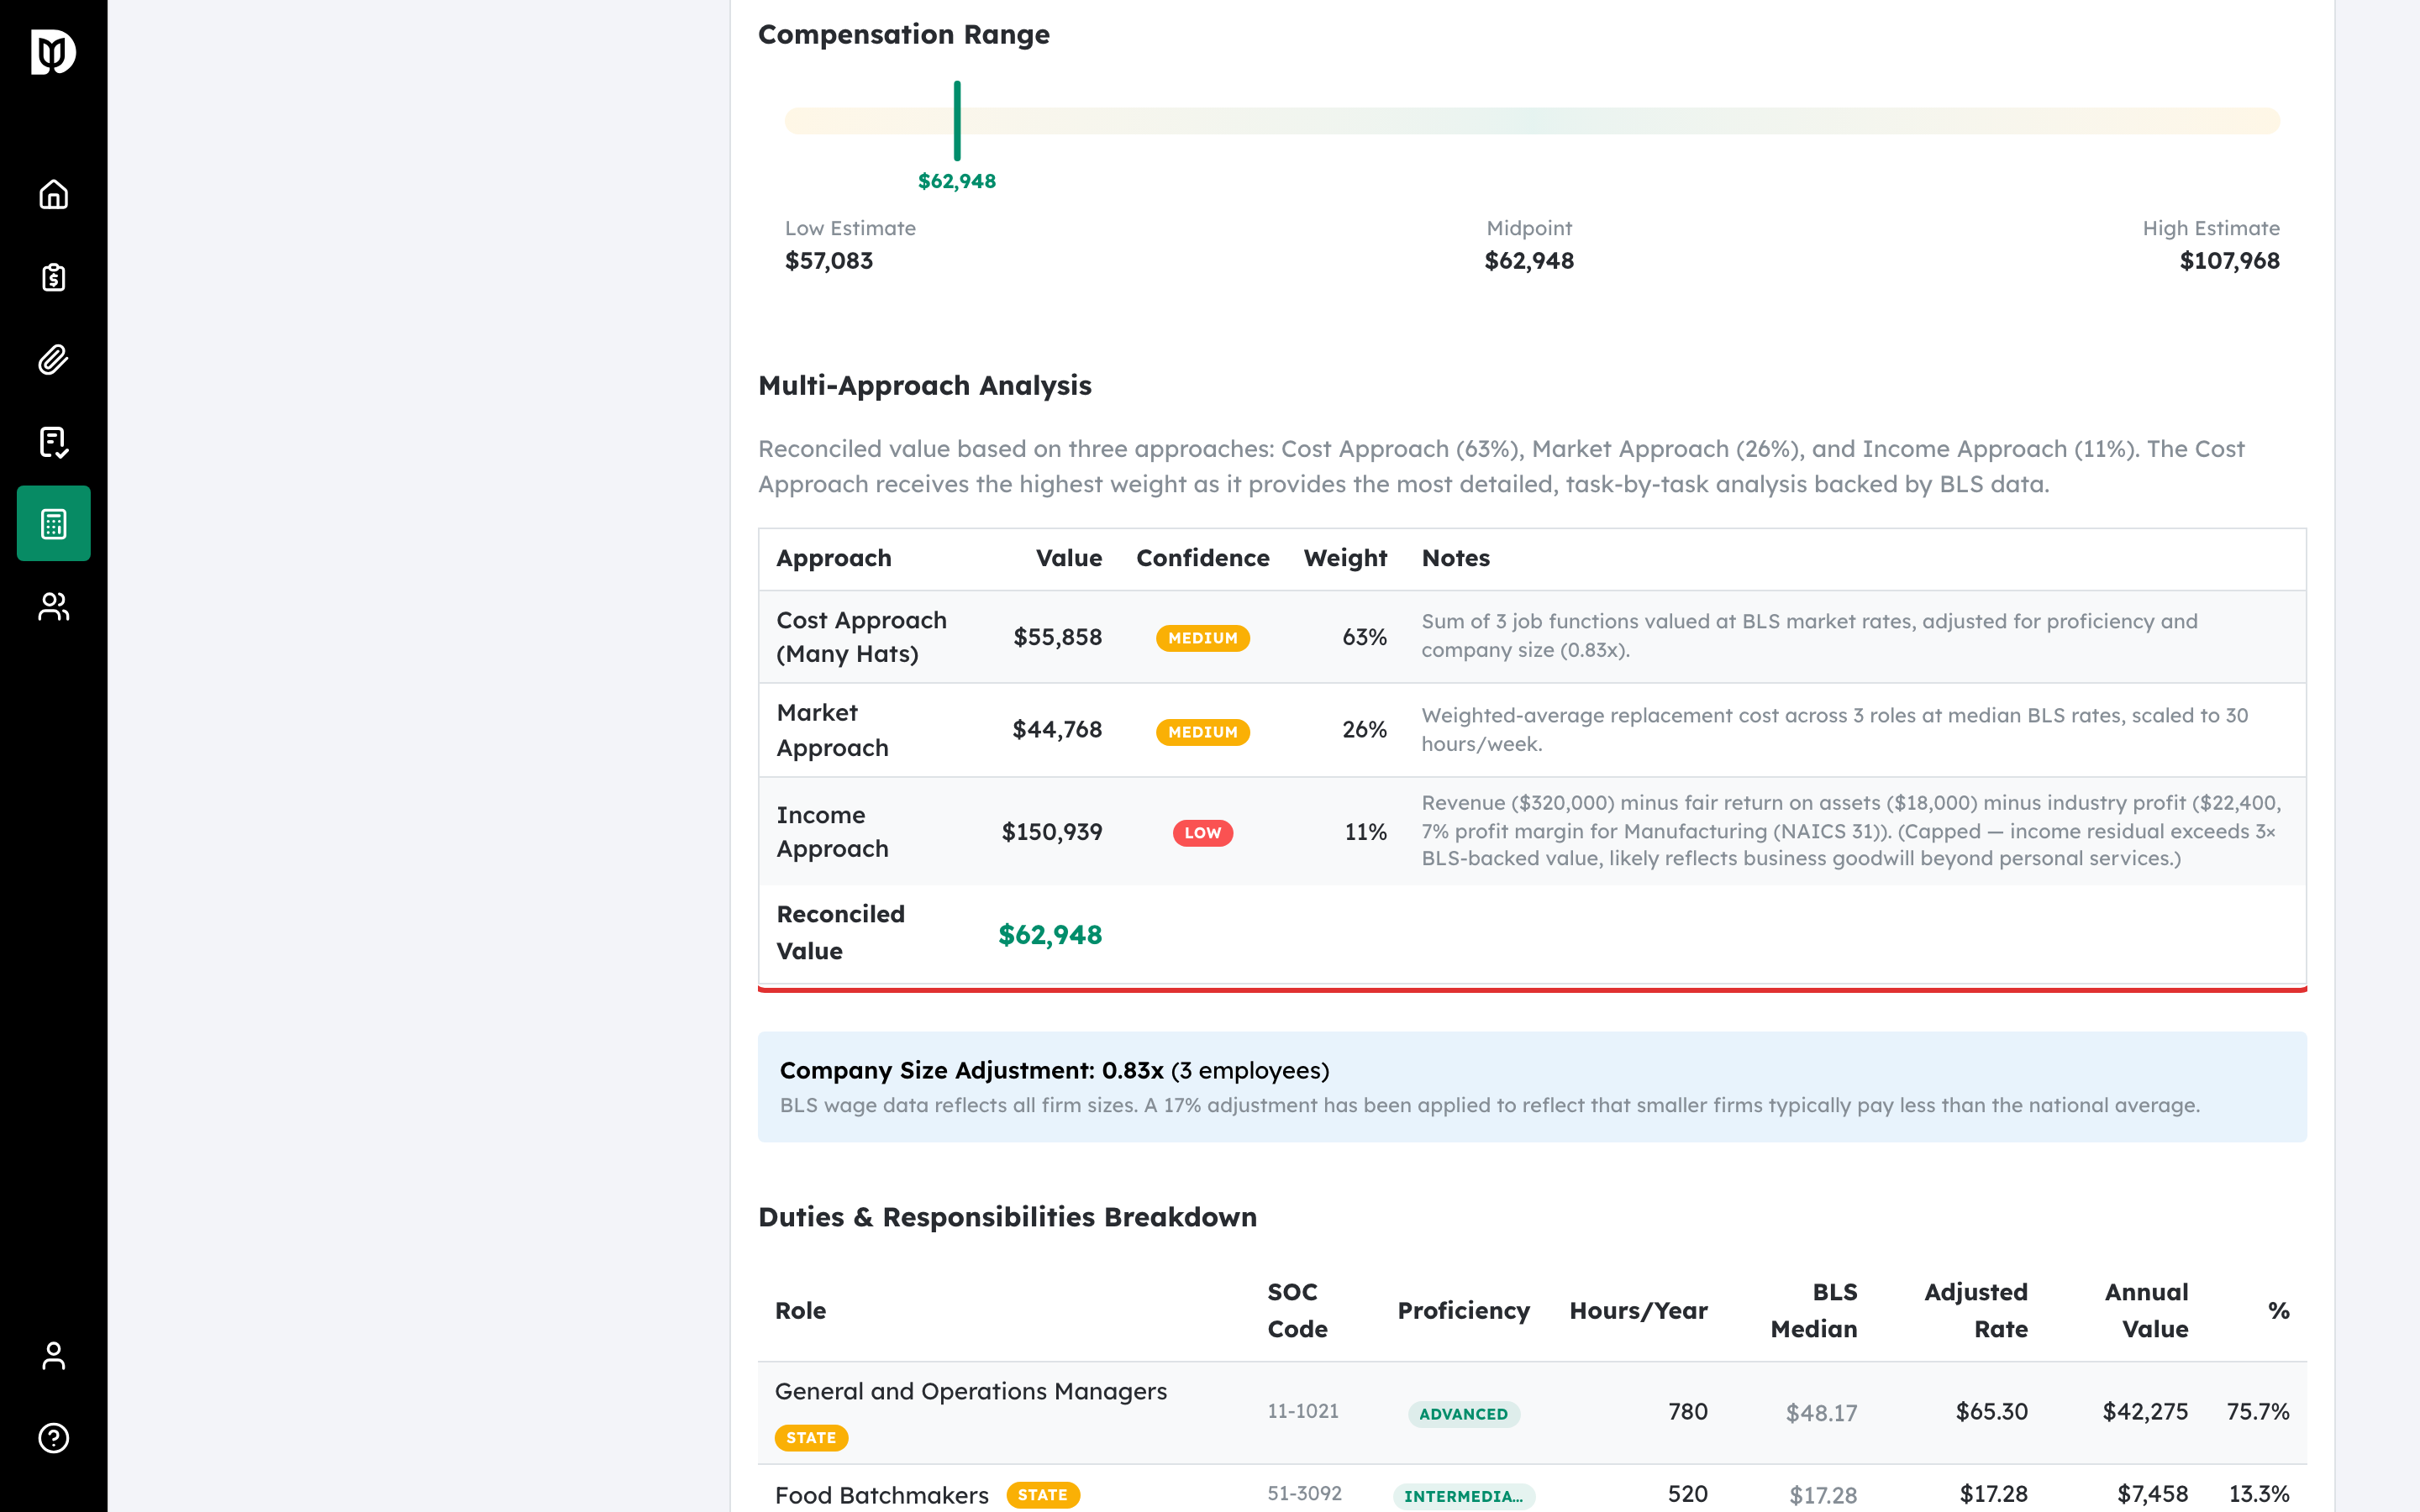
Step 5: Examine the Task Breakdown #
The Task Breakdown table is the detailed foundation of the compensation calculation. Each row represents one job role and includes:
- Role: The job title, with a small colored badge showing the geographic match type (metro, state, or national) and a warning icon if there are data quality concerns.
- Category: The job category (for example, Executive, Financial, Sales).
- Hours/Year: Annual hours for this role (weekly hours multiplied by 52).
- Hourly Wage: The BLS wage rate adjusted for geographic location and proficiency level.
- Annual Value: The compensation contribution from this role (hours multiplied by wage).
- % of Total: What percentage of total compensation this role represents.
The footer row shows the totals across all roles. Hover over a warning icon to see details about data quality issues for that role.
Step 6: Review the IRS Audit Defense Notes #
The IRS Audit Defense Notes card provides documentation to support the compensation determination in case of an IRS audit. The notes cover:
- The methodology used (Cost Approach / Many Hats)
- BLS data source citation
- Geographic wage adjustment details
- Multi-role justification
- Proficiency-level adjustments
- Hours documentation
- Effective rate reasonableness check
- Documentation retention guidance
Step 7: Review the Methodology section #
The Methodology card at the bottom of the report describes the Cost Approach (Many Hats) methodology and cites the BLS OEWS data source. It also shows the date the report was generated.
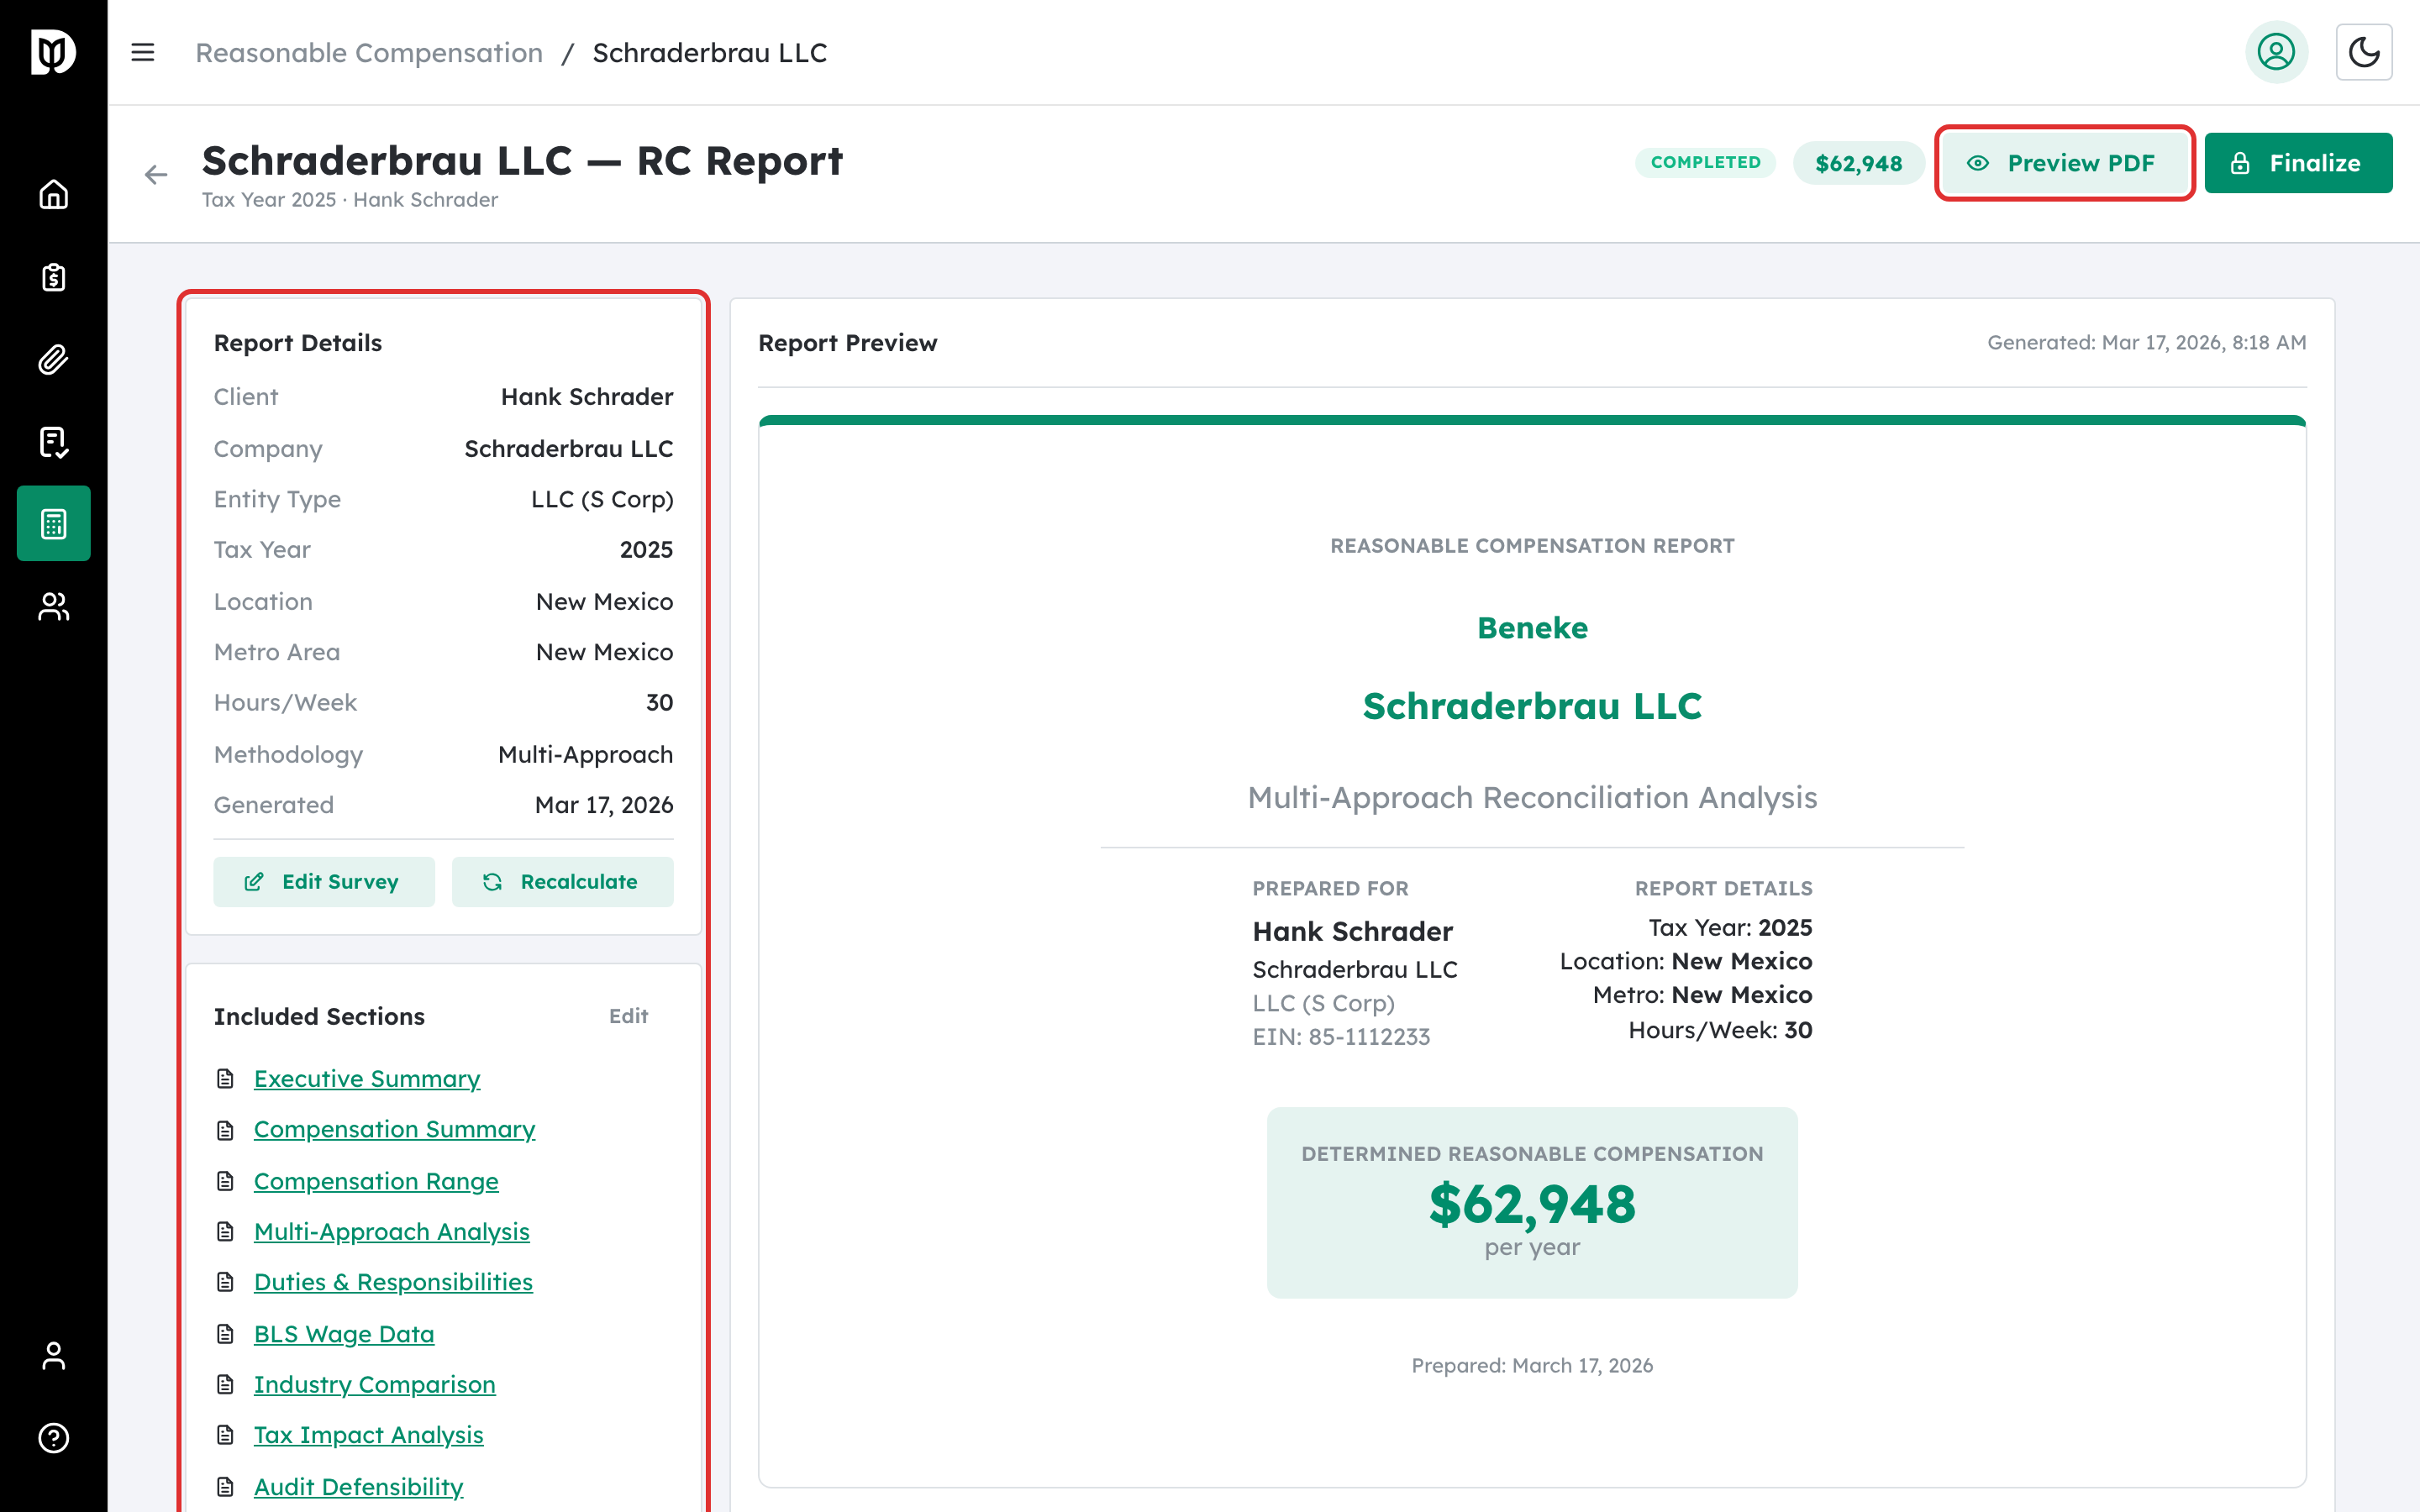
Step 8: Export the report as a PDF #
Click the Export button in the top-right corner of the report page. A dropdown menu appears with three options:
- Download PDF: Generates and downloads a PDF version of the report. The file is named using the format RC_Report_CompanyName_TaxYear.pdf.
- Export to Word (Coming Soon): This option is currently disabled and will be available in a future update.
- Export to Excel (Coming Soon): This option is currently disabled and will be available in a future update.
Step 9: Return to the dashboard #
Click the Back to List button in the top-left corner to return to the survey dashboard.
What happens next #
After downloading the PDF, you can share it with your client, include it in tax filings, or keep it in your records as documentation for the compensation determination. The report remains accessible from the dashboard at any time.
Troubleshooting #
- The report page shows “Survey not found”: The survey ID in the URL may be incorrect. Go back to the dashboard and click the correct survey to reopen the report.
- The PDF download does not start: The PDF is generated in your browser using the report content. If your browser blocks downloads, check your popup and download settings. Try again after a moment — large reports may take a few seconds to process.
- Some tasks show warning icons: This means the BLS wage data for those roles has quality concerns, such as using national-level data instead of state-level data, or the data year being older than expected. The compensation calculation is still valid, but you may want to note these warnings in your files.
- The Data Quality badge shows Low Confidence: Consider reviewing your role selections. Low confidence may result from using national fallback data for most roles or from very old BLS data. Adjusting the geographic location or role selections may improve data quality.


