

Who this is for: Accountants deciding which sections to include when building a report.
What you’ll learn: What every report section shows, so you can assemble the right report for each client.
Before you begin #
- Sections are chosen in Edit Report Sections and can be reordered freely.
- You don’t need every section — a bookkeeping client might get a Simple P&L, while a fractional-CFO client gets the full pack.
Statements and summaries #
- Executive Summary — headline metrics: revenue, gross profit, net income, cash, and profit margin, with prior-period comparisons.
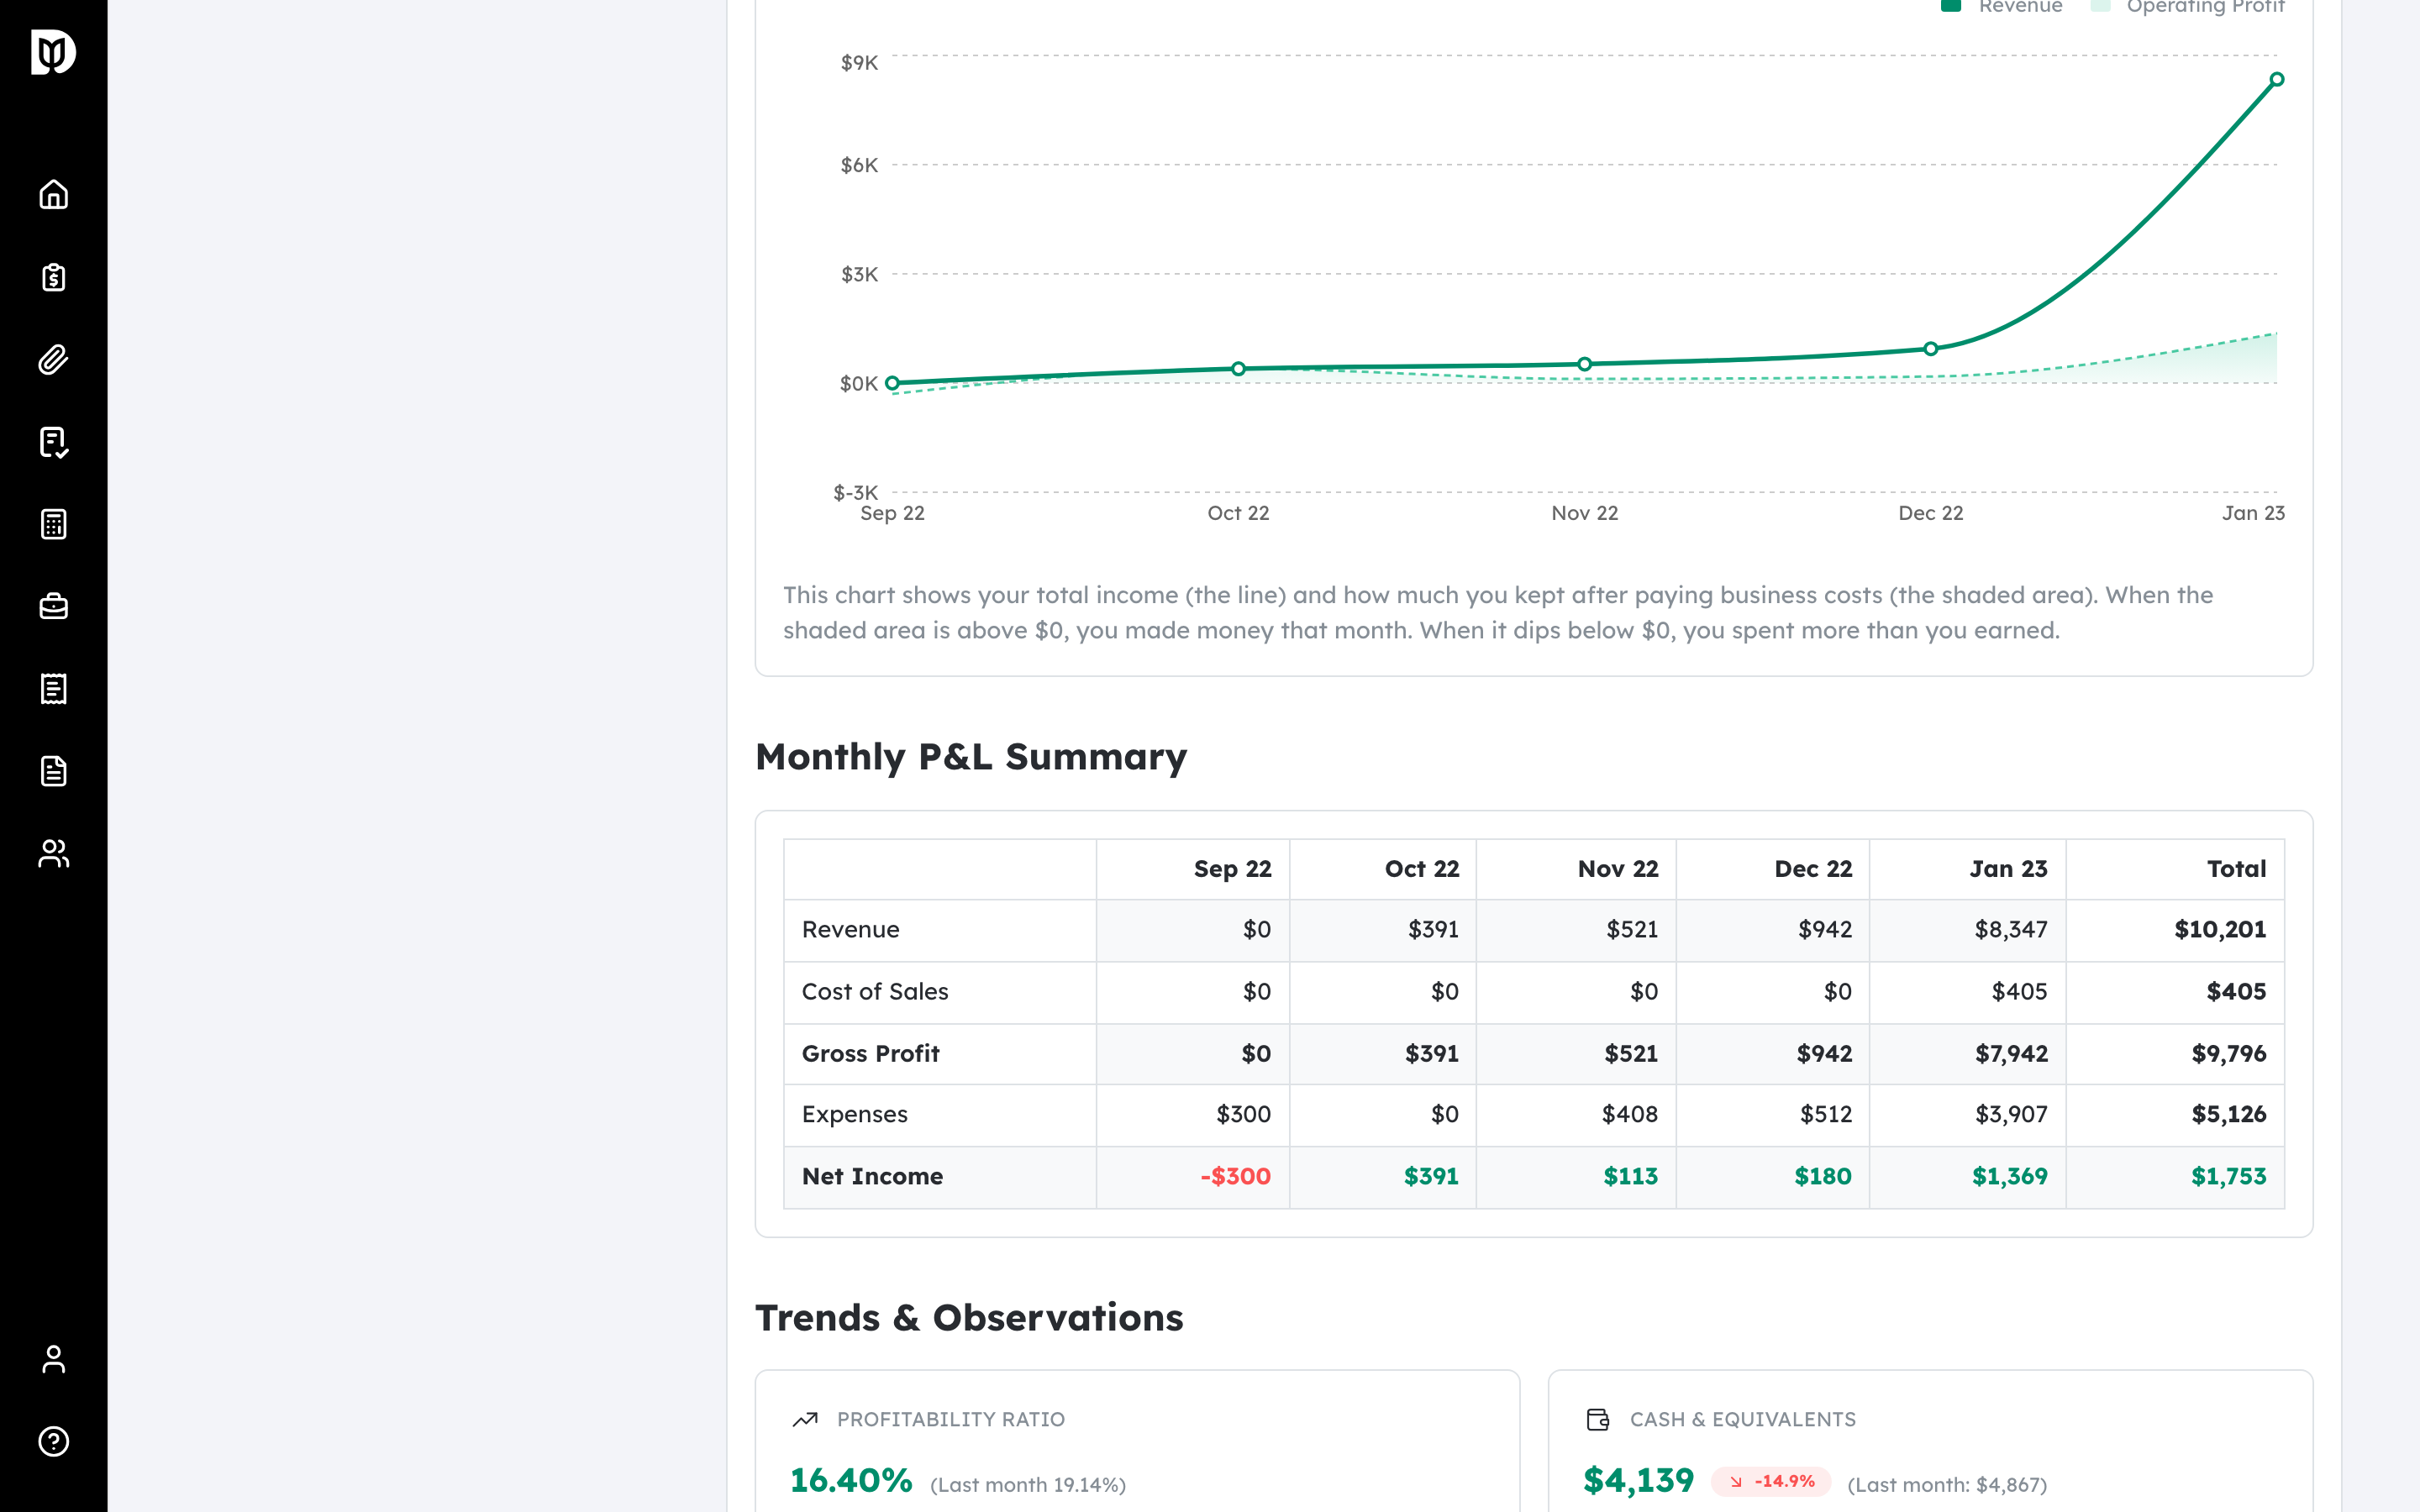
- Revenue & Net Income Trend — a chart of revenue and operating profit over time (the Overview / Profitability Overview).
- Monthly P&L Summary — a month-by-month table of revenue, expenses, and net income.
- Profit & Loss Statement — the full P&L for the last closed month, with every account.
- Profit & Loss — Year to Date — the P&L from the fiscal year start through the report month.
- Profit & Loss by Month — the full fiscal-year P&L with a column for each month.
- Profit & Loss — Year over Year — this year to date versus the same period last year, with variance.
- Balance Sheet — assets, liabilities, and equity.
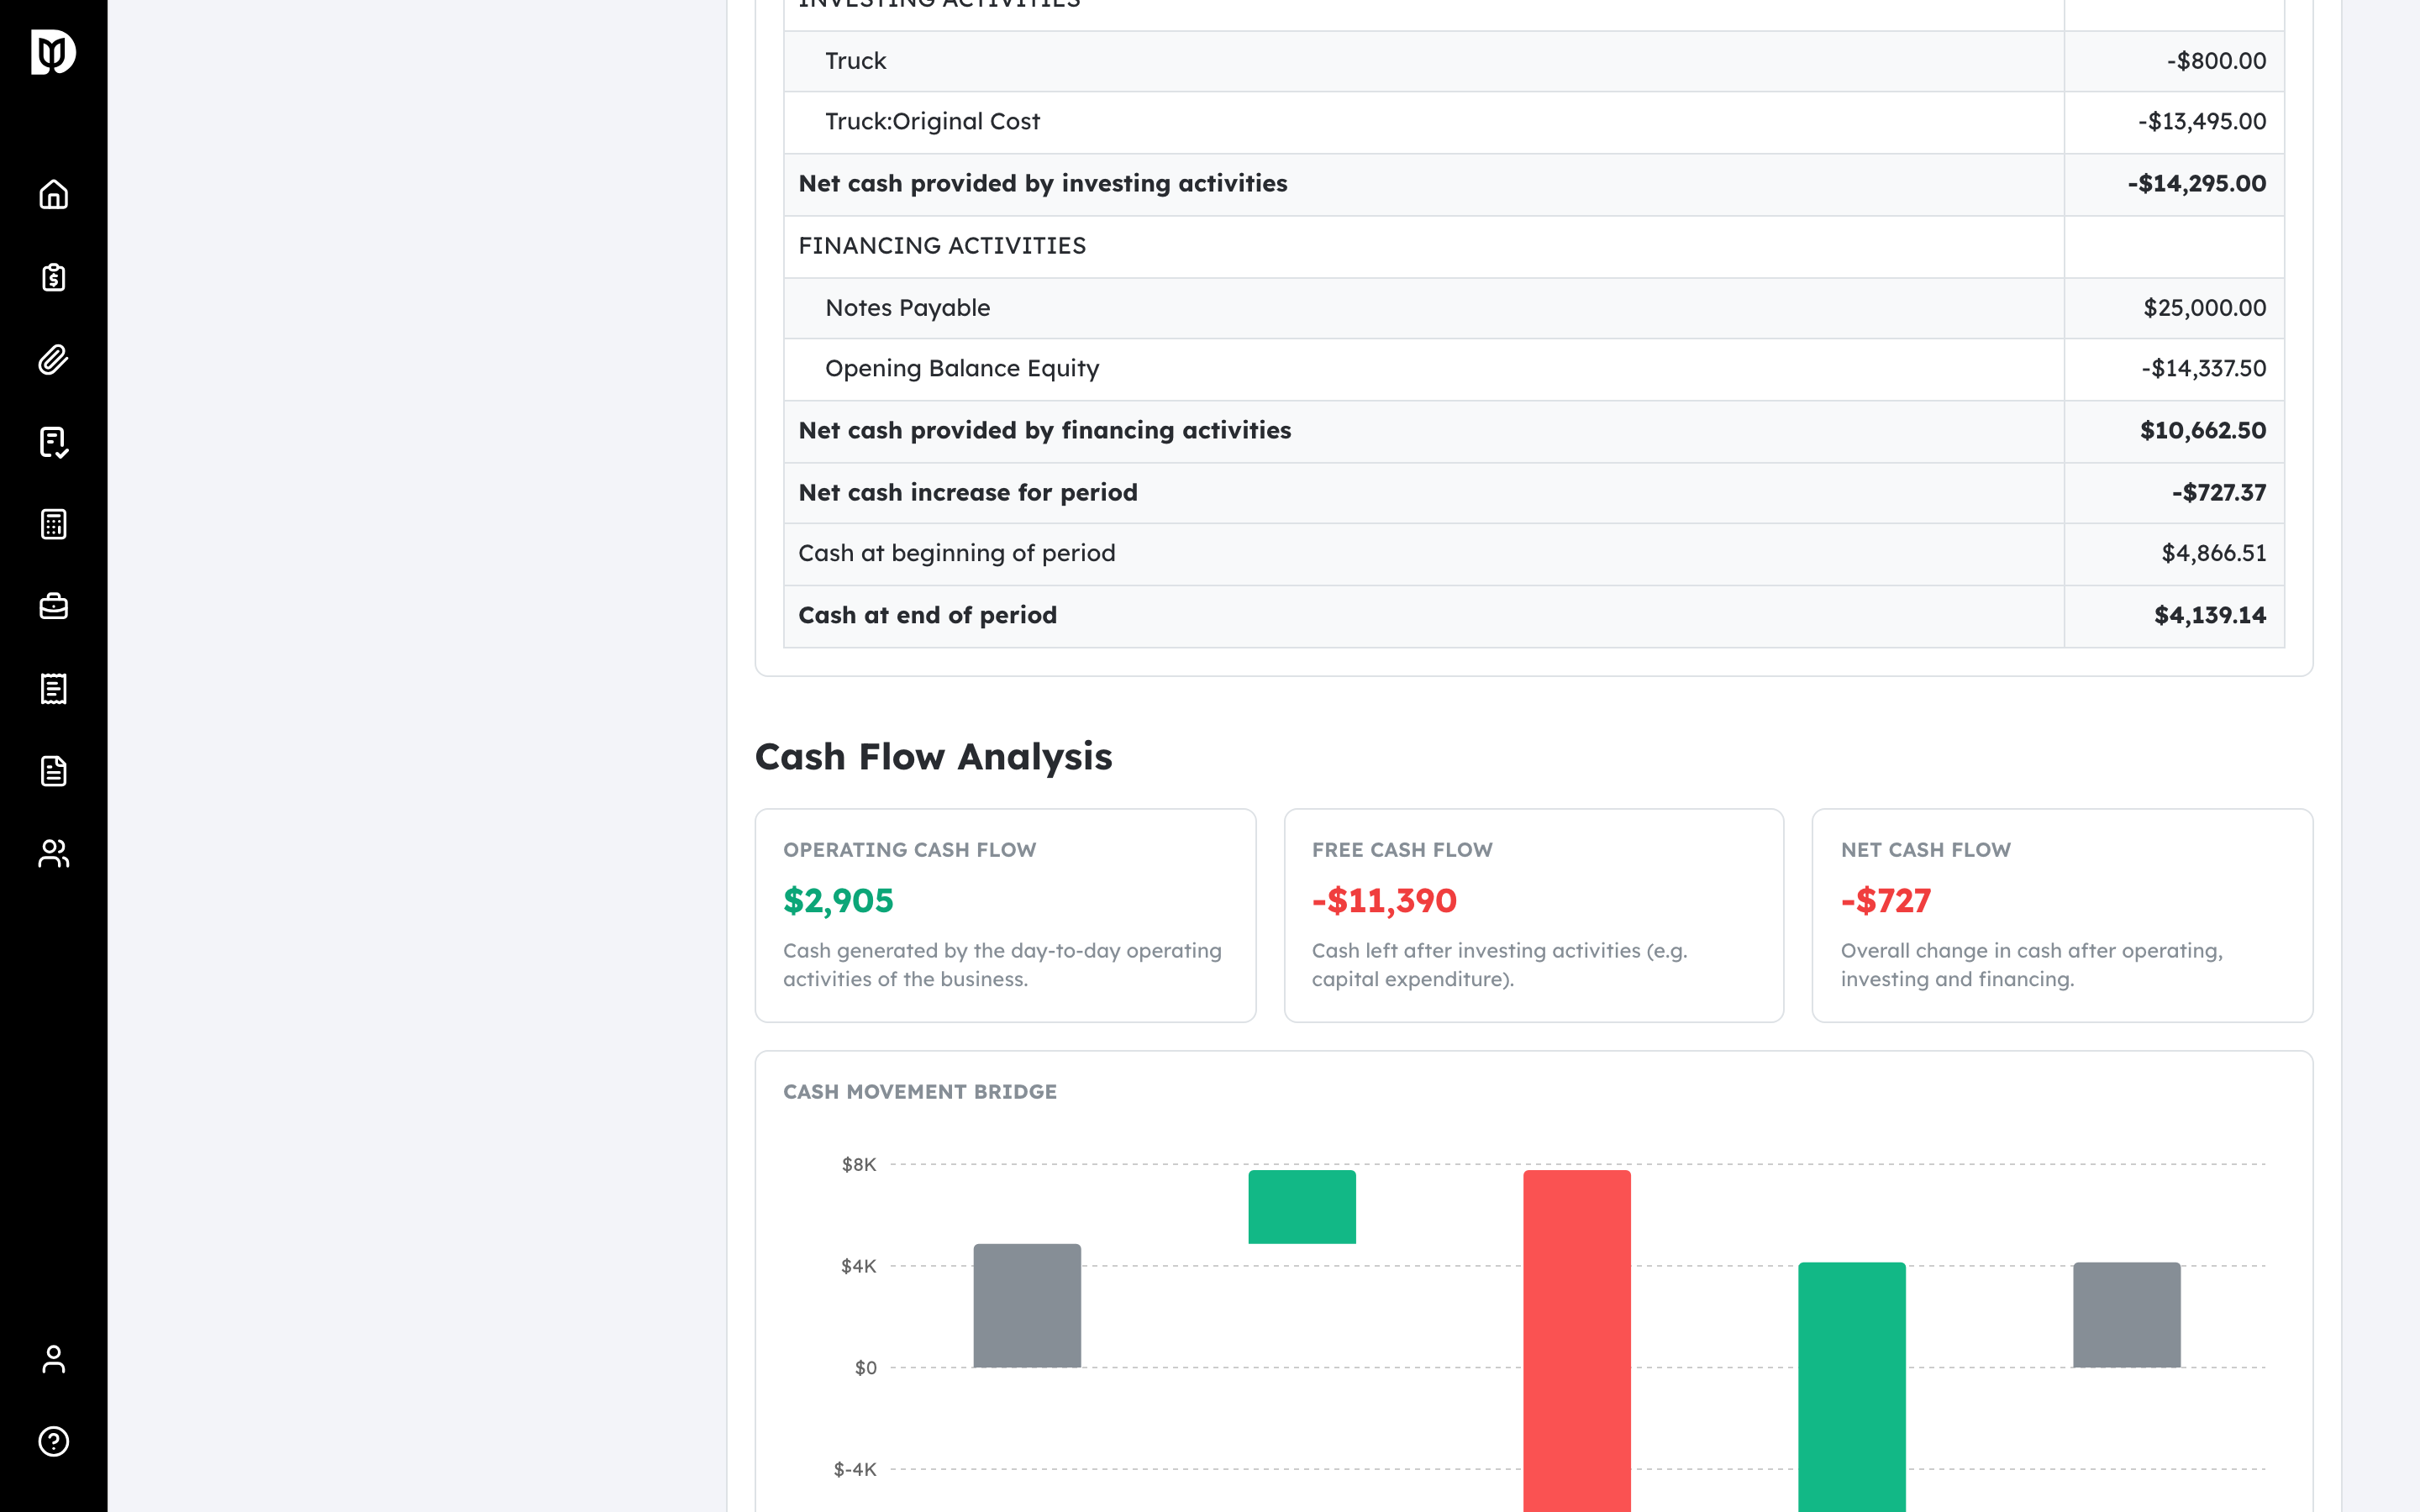
- Cash Flow Statement — operating, investing, and financing activities.
CFO analysis #
- Cash Flow Analysis — operating, free, and net cash flow shown as a cash-movement bridge with a reconciliation from beginning to ending cash.
- Financial Ratios — margins, liquidity, leverage, and return ratios.
- KPI Summary — a visual scorecard of KPIs grouped by perspective with on-track versus off-track status.
- KPIs Explained — a plain-English appendix explaining each KPI: value, formula, target, and status.
- Custom KPIs — your own KPIs computed from report metrics.
- Budget vs Actual — planned budget against actuals, with variance and coloring.
- Expense Analysis — expense-breakdown charts and top expense categories.
- Trends & Observations — cash position, total liabilities, and gross-profit insights.
- Forecast — a multi-scenario revenue and expense projection.
Narrative and closing #
- Accountant Commentary — your narrative for the client, shown on the cover.
- Narrative / Text — free-form text you place anywhere in the report.
- Disclaimer — the basis-of-preparation and limitations statement.
What happens next #
Once you know which sections you want, add them in Edit Report Sections or save a template so you can reuse the same set for other clients.
Troubleshooting #
- Problem: A ratio shows “N/M”. That ratio isn’t meaningful for the period (for example, return on equity when equity is negative).


