

Who this is for: Accountants and clients reading the KPI sections of a report.
What you’ll learn: How to interpret the KPI Summary scorecard and the KPIs Explained appendix.
Before you begin #
- Add the KPI Summary and KPIs Explained sections to include the scorecard.
- KPIs are grouped into four perspectives: Profitability, Liquidity, Cash Flow, and Growth.
Step-by-step instructions #
Step 1: Read the on-track percentage #
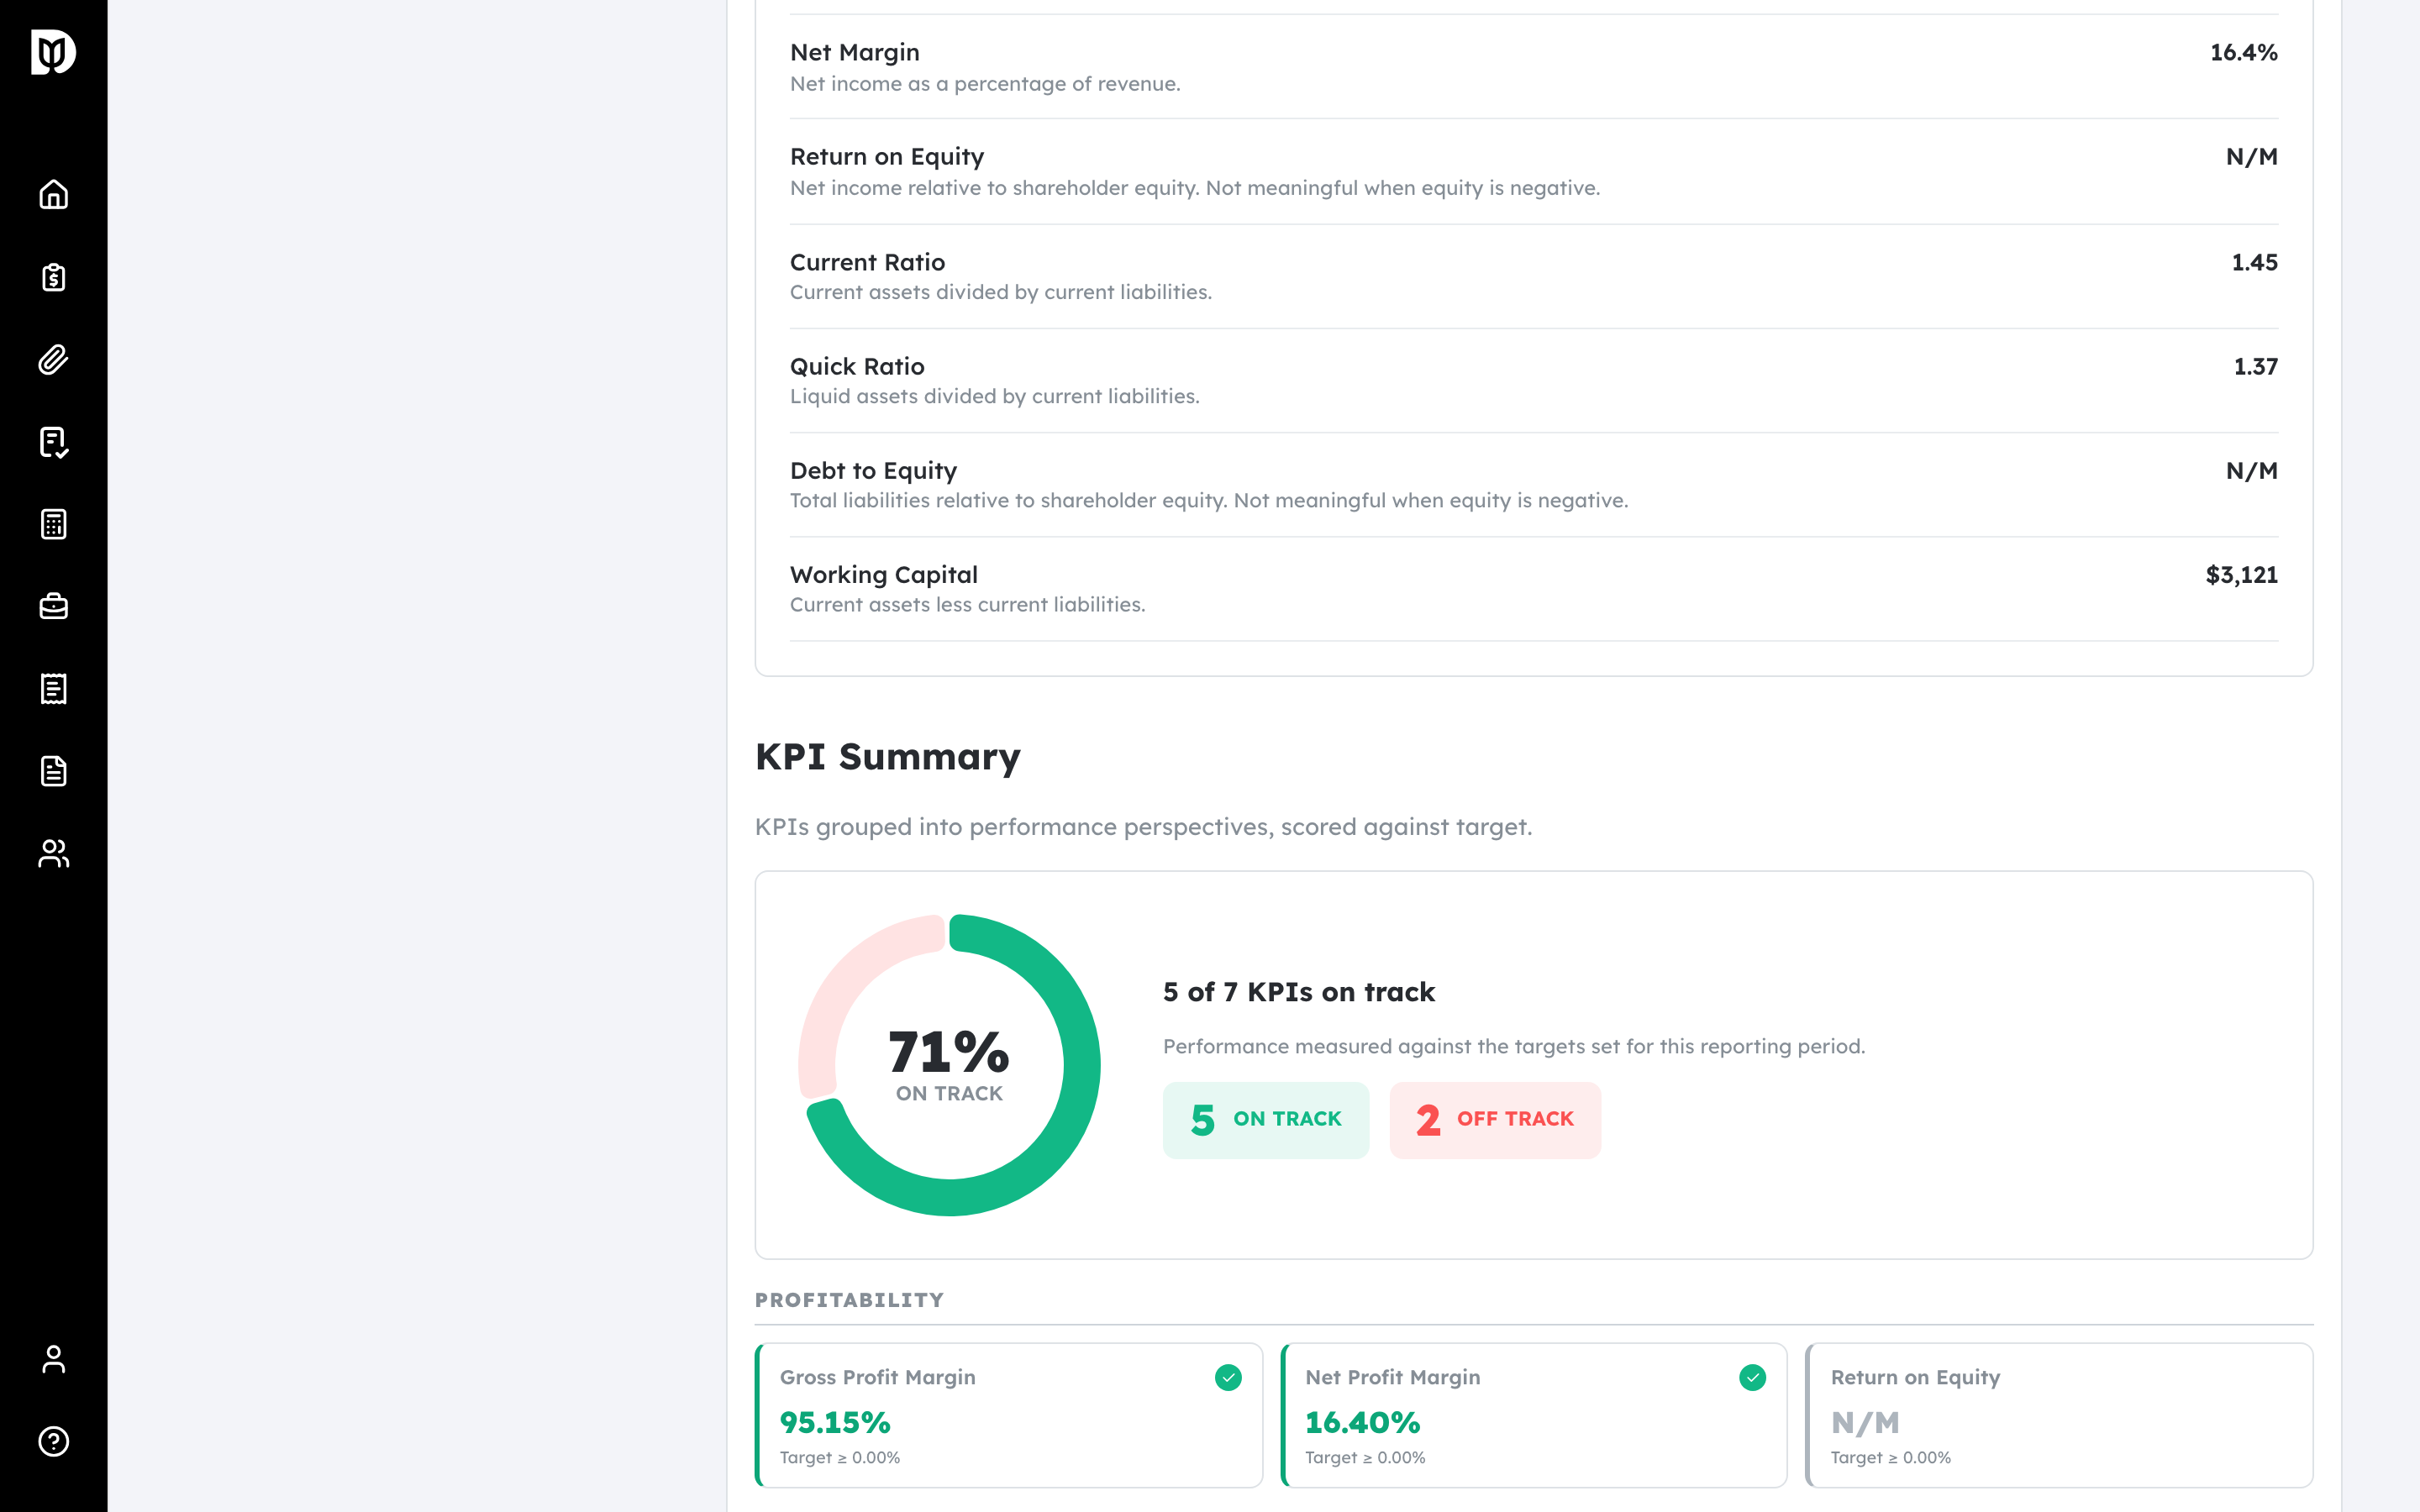
The KPI Summary shows a gauge with the percentage of KPIs on track, plus counts of how many are on track and off track for the period.
Step 2: Review each perspective #
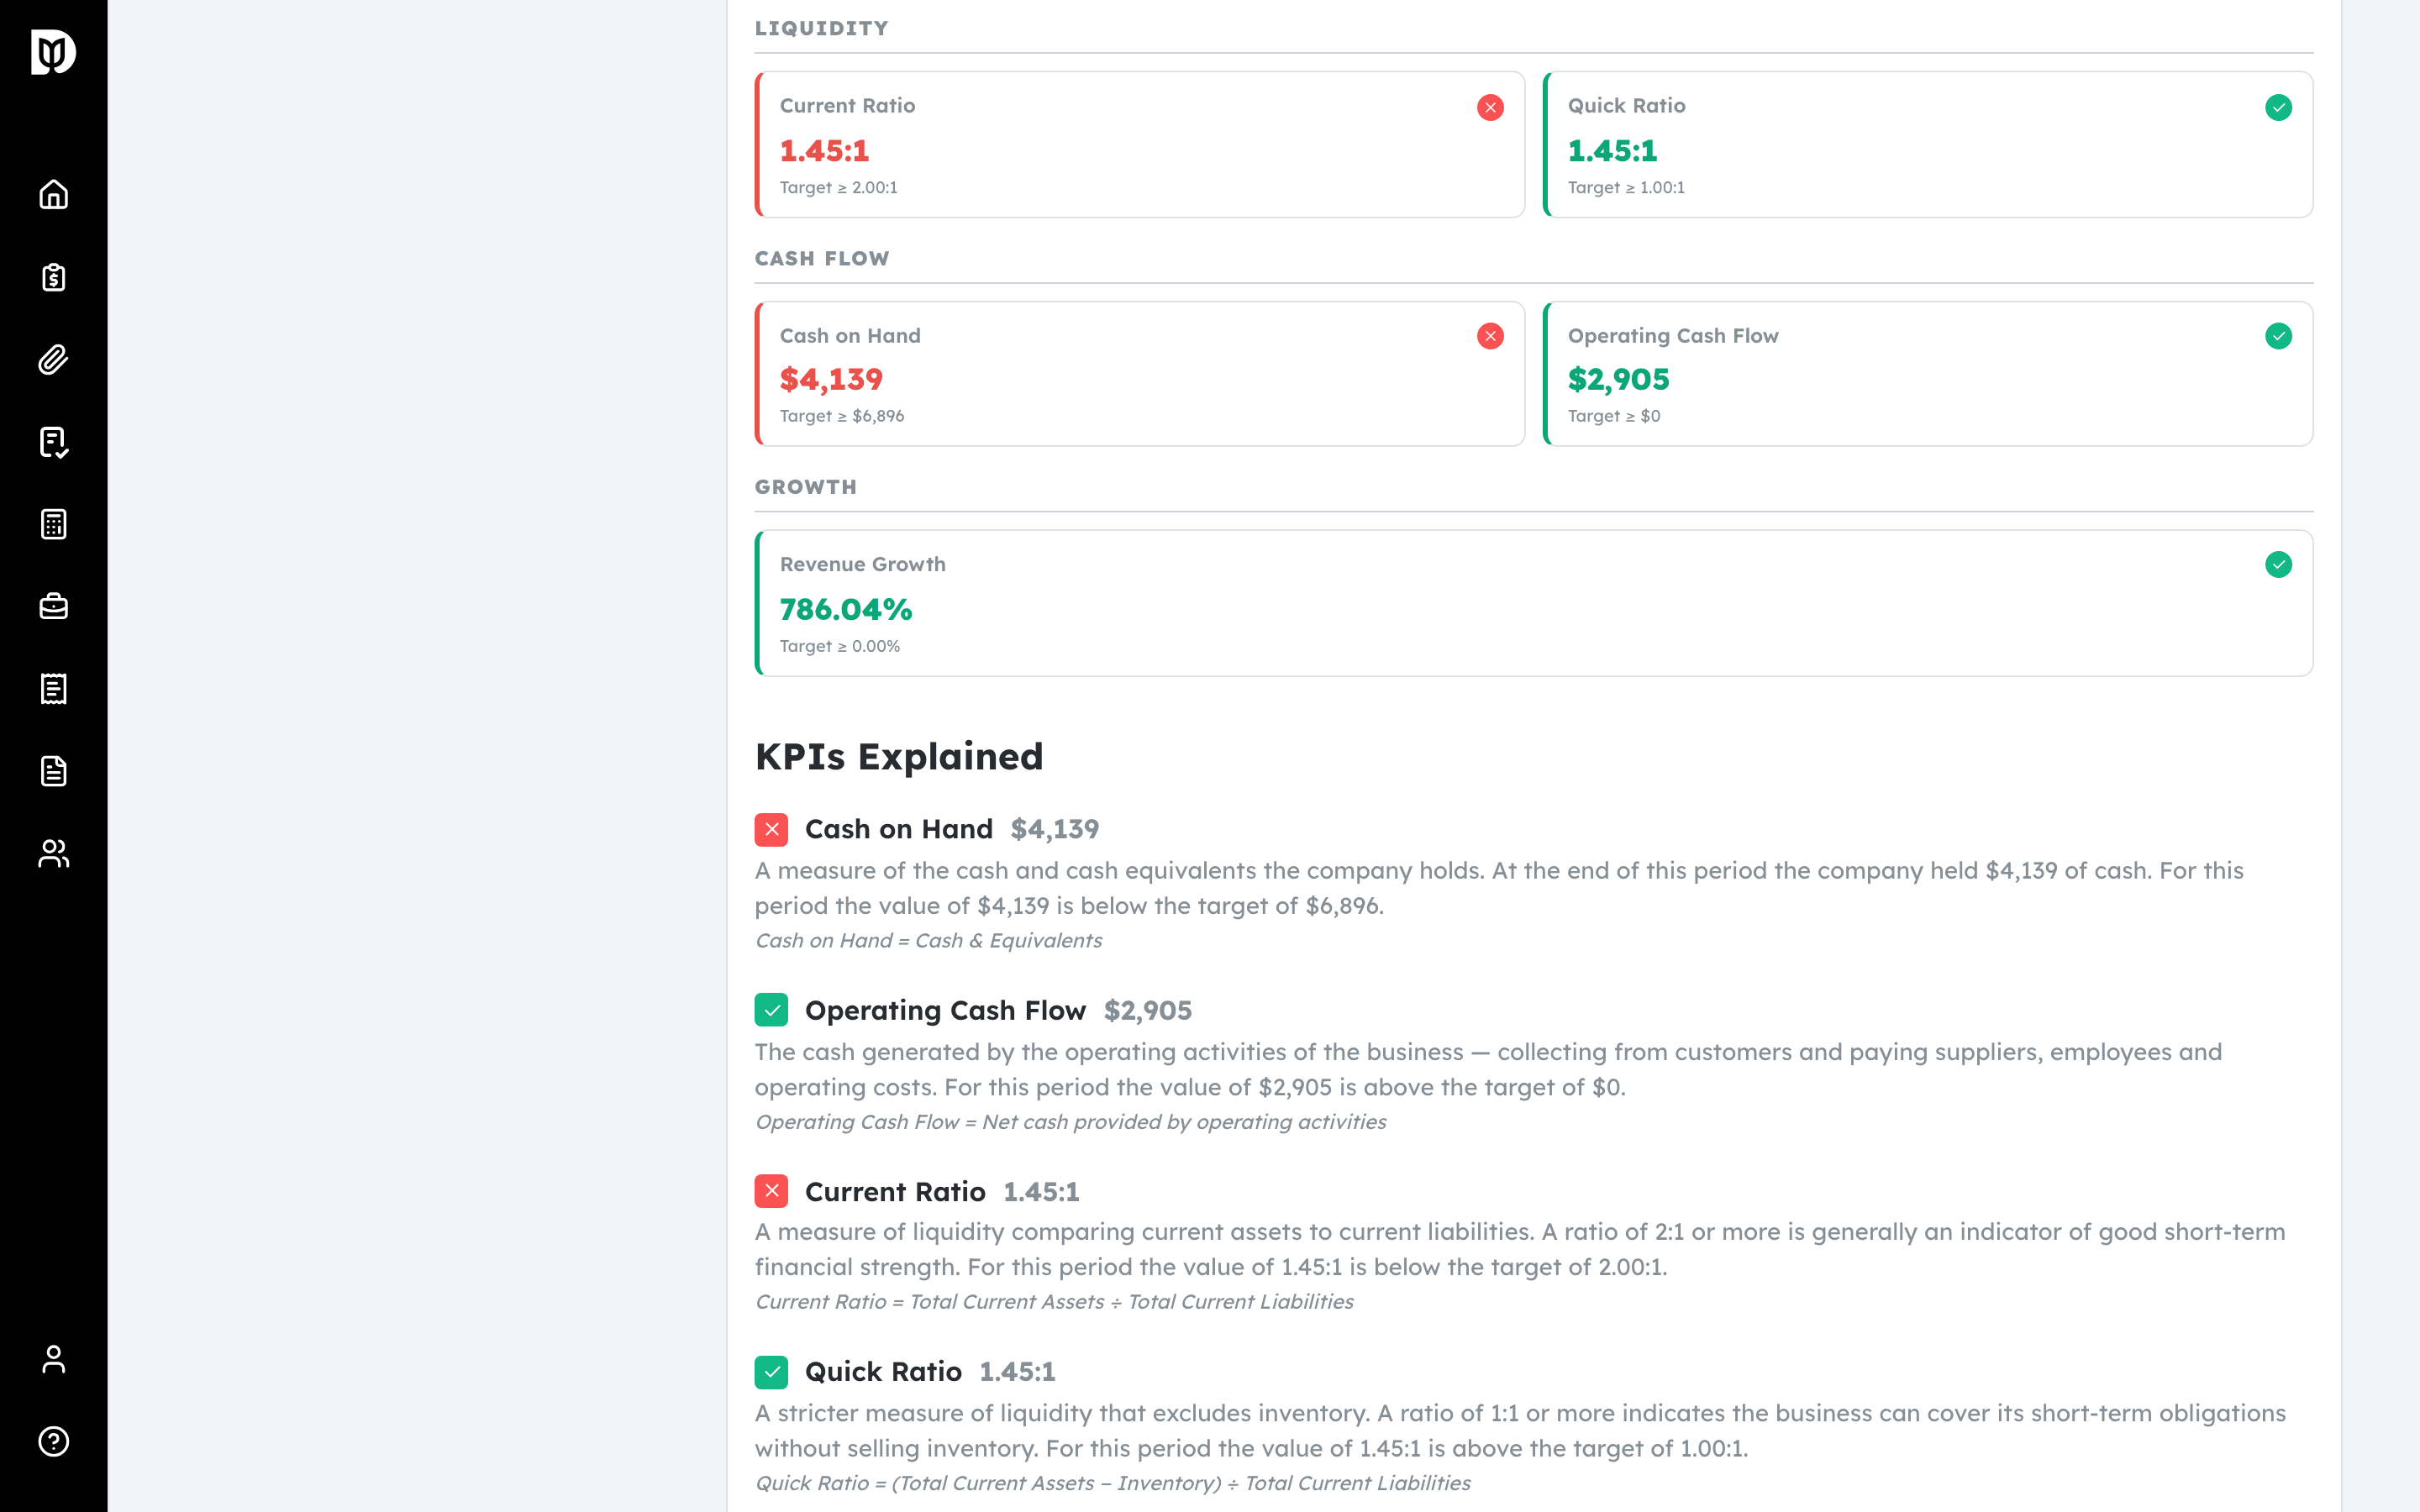
Under the gauge, each perspective lists its KPIs with the value and target. A green check means on track; a red mark means off track.
Step 3: Read the plain-English explanations #
The KPIs Explained appendix describes each KPI in plain language, with its value, target, status, and the formula behind it.
What happens next #
Use the scorecard to focus the client conversation on the KPIs that are off track.
Troubleshooting #
- Problem: A KPI shows “N/M”. It isn’t meaningful for the period — for example a return ratio when equity is negative.


