Who this is for: Accountants who want to show tailored metrics beyond the standard statements.
What you’ll learn: How to add a Custom KPIs section and build KPIs from the report’s own metrics.
Before you begin
- Open a draft report and add the Custom KPIs section in Edit Report Sections.
- KPIs are computed from report metrics such as revenue, gross margin, net income, expenses, operating cash flow, cash balance, total liabilities and the standard ratios.
Step-by-step instructions
Step 1: Find the Custom KPIs section
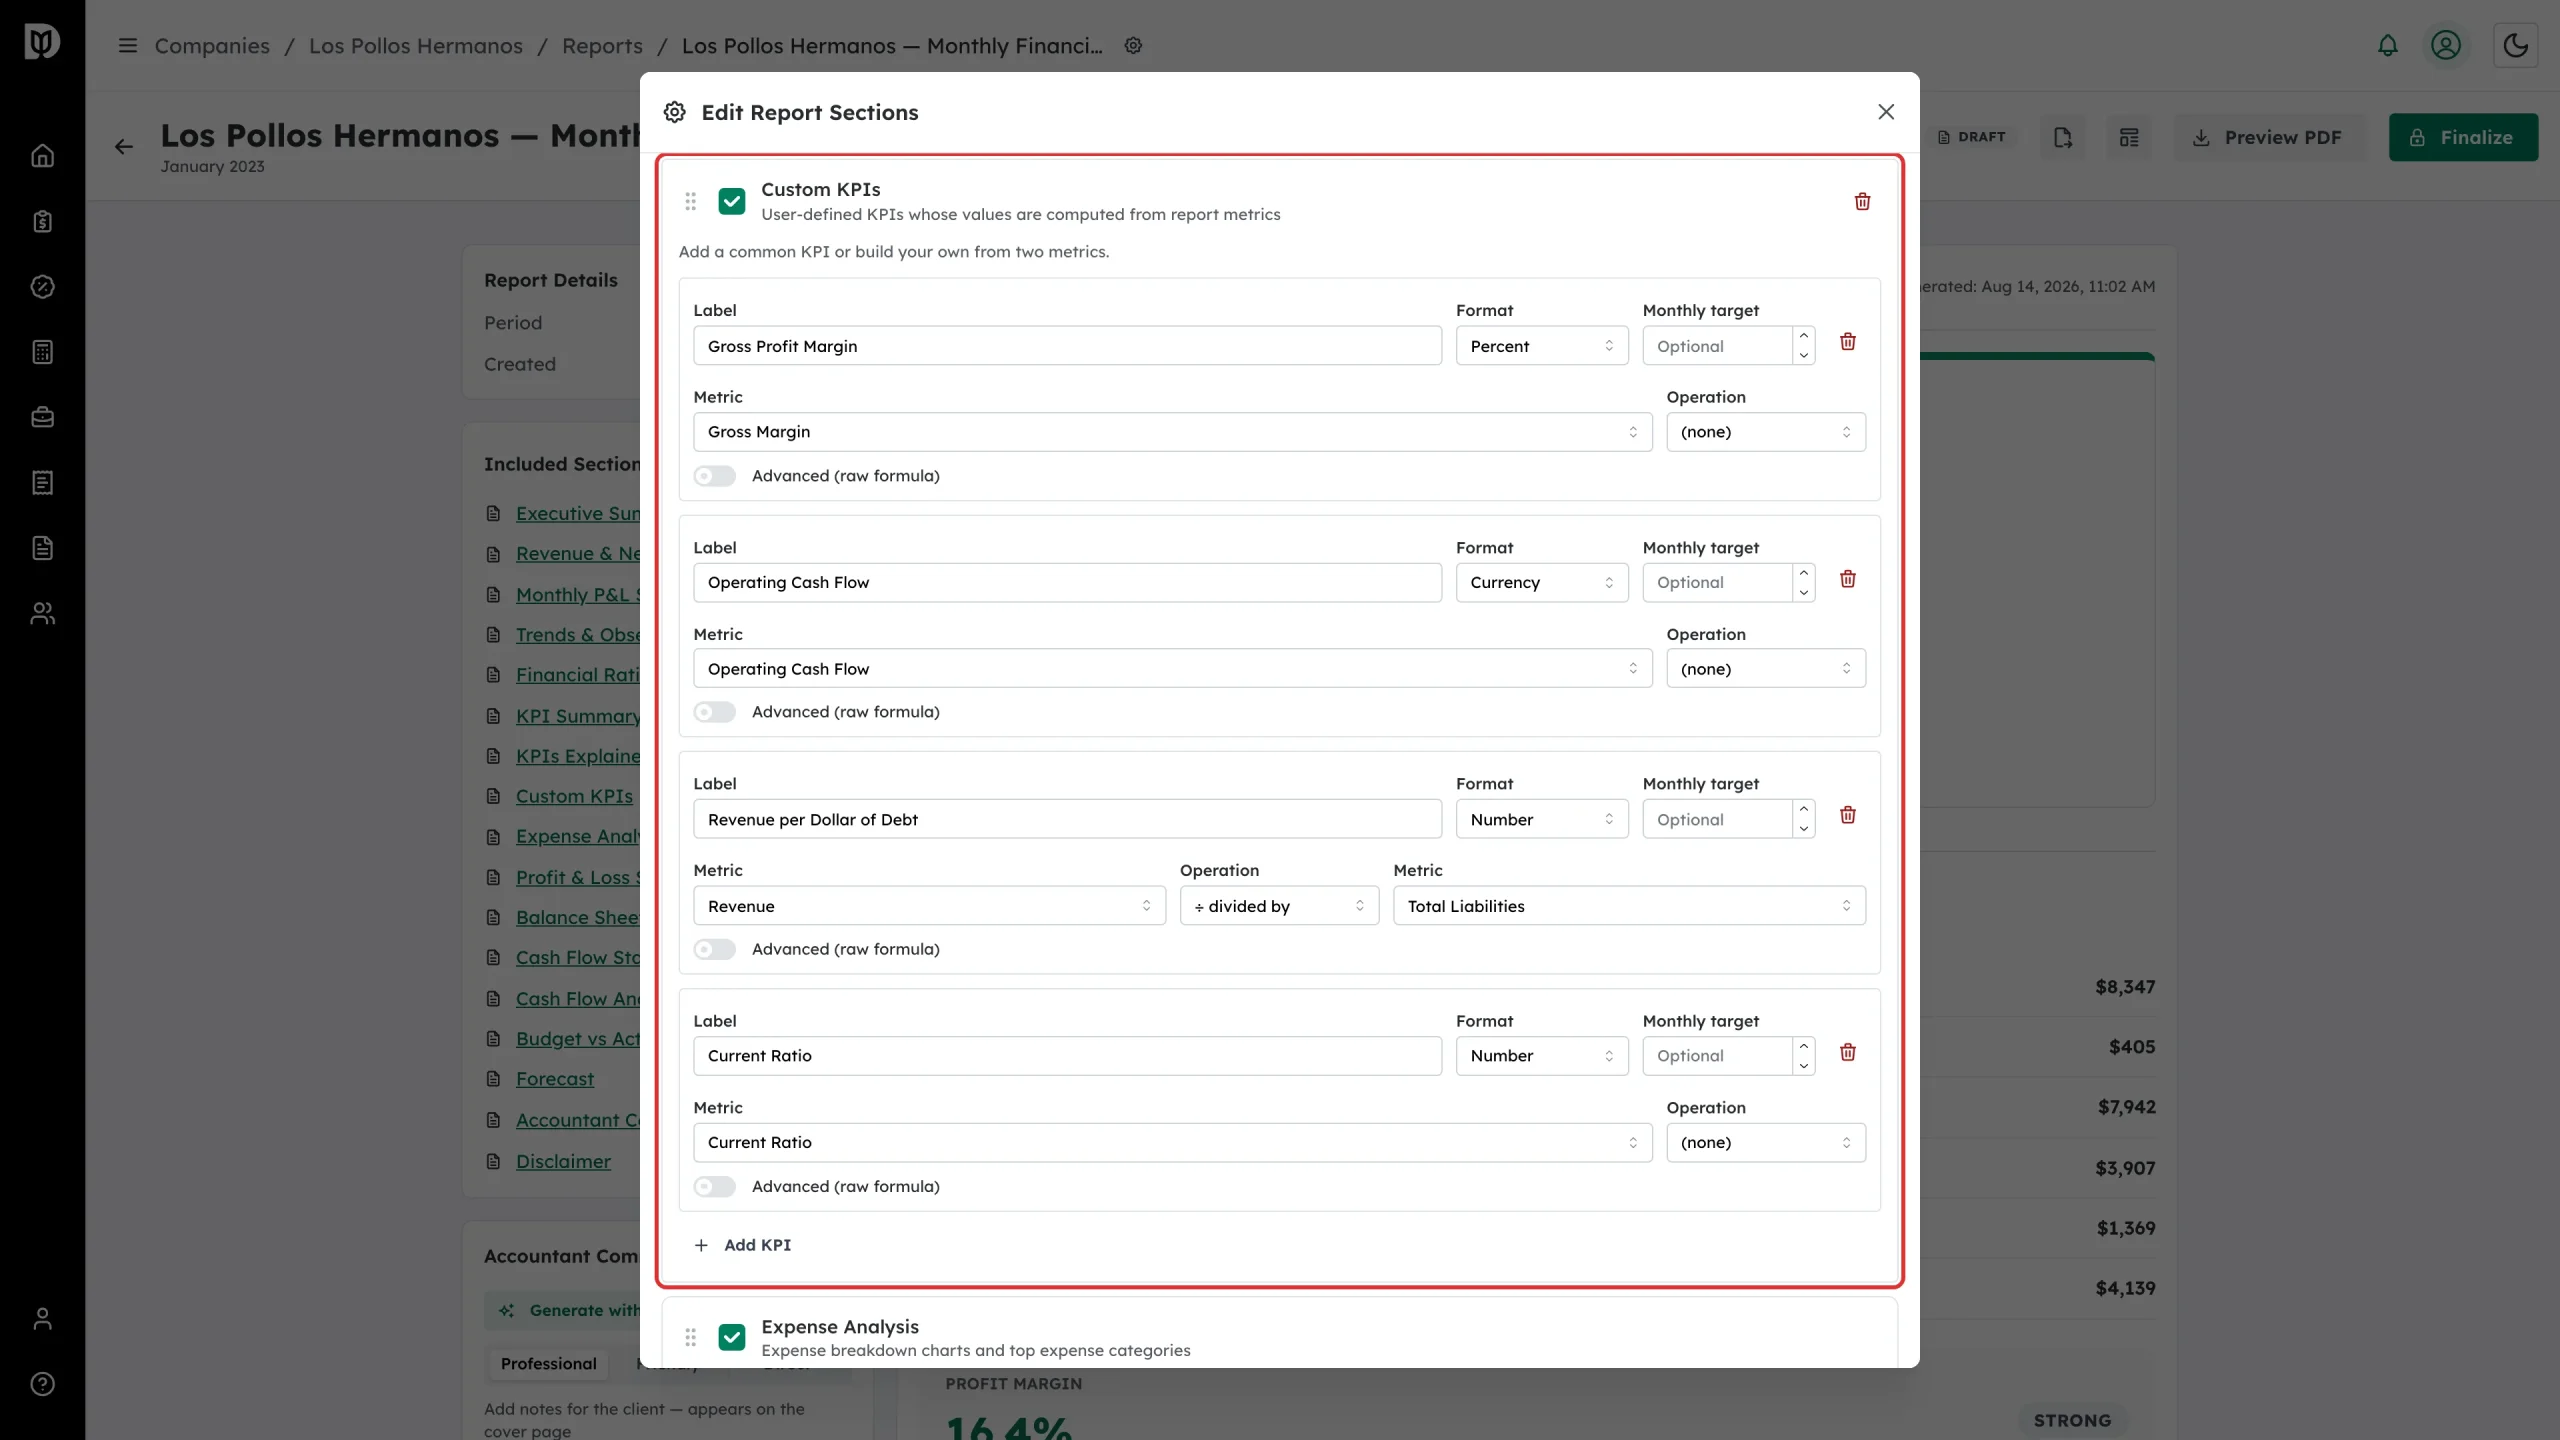
In Edit Report Sections, scroll to Custom KPIs. Each KPI already in the report is listed as its own row.
Step 2: Look at a KPI row
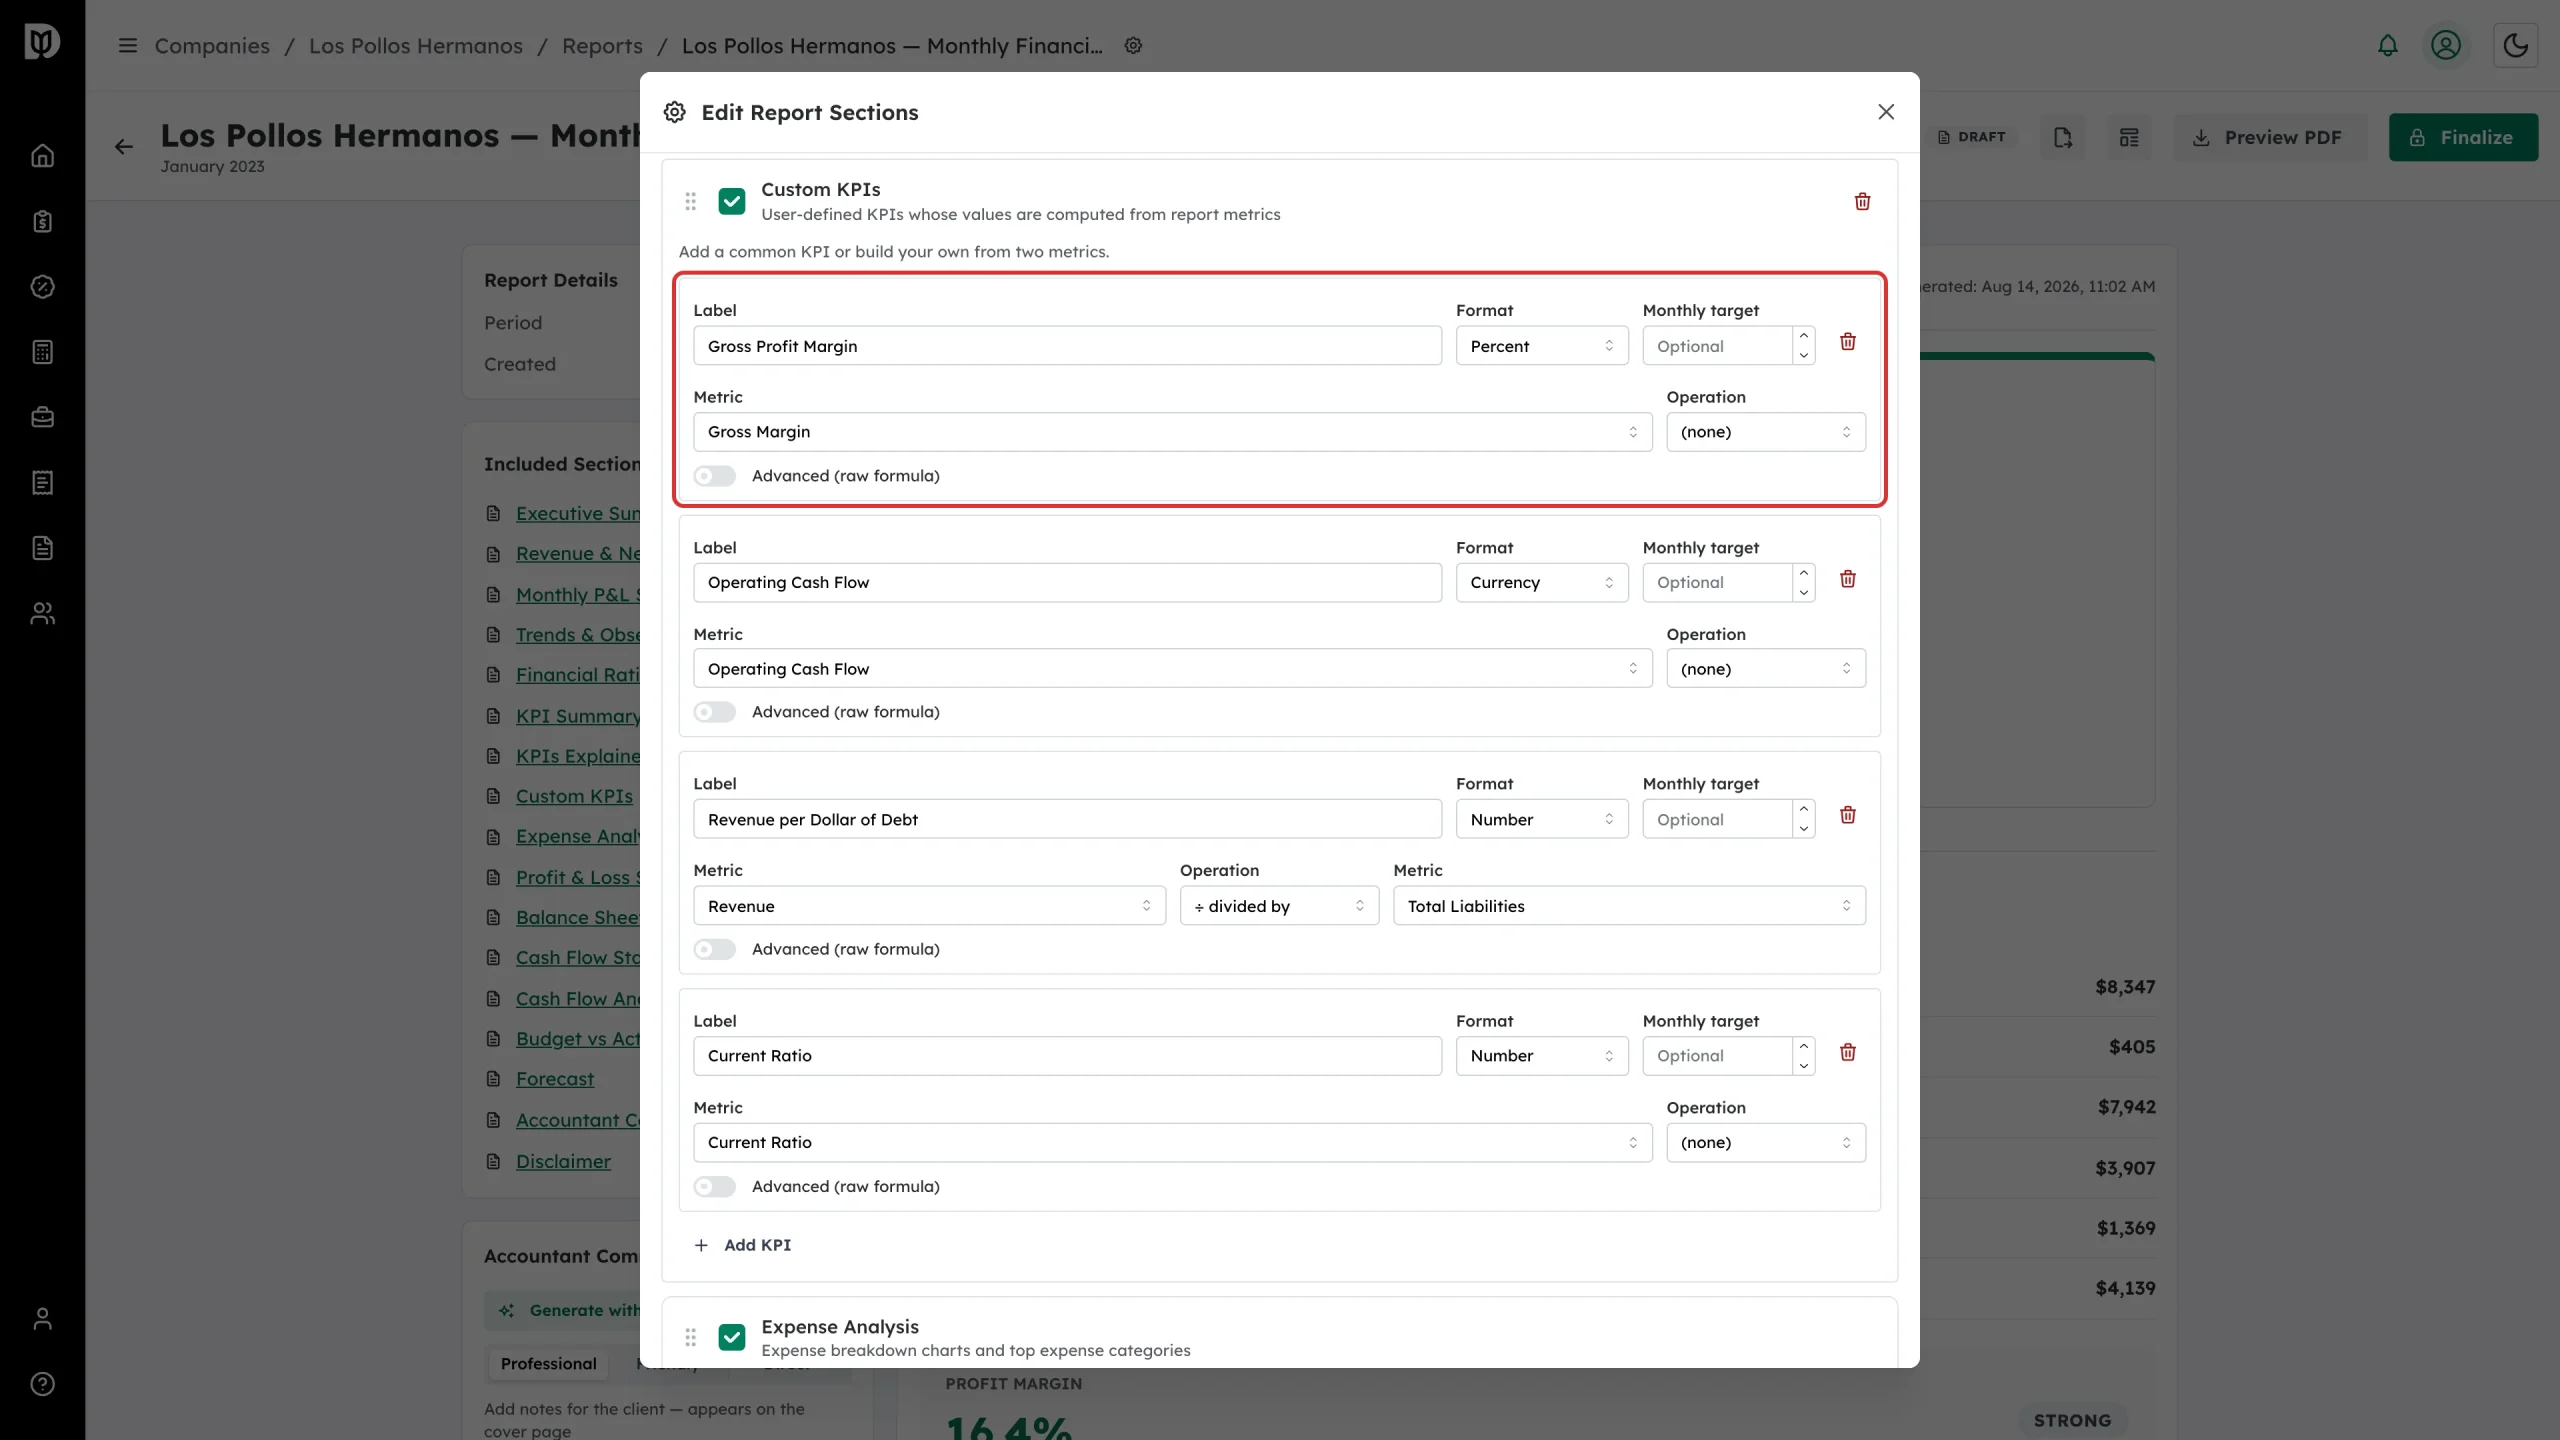
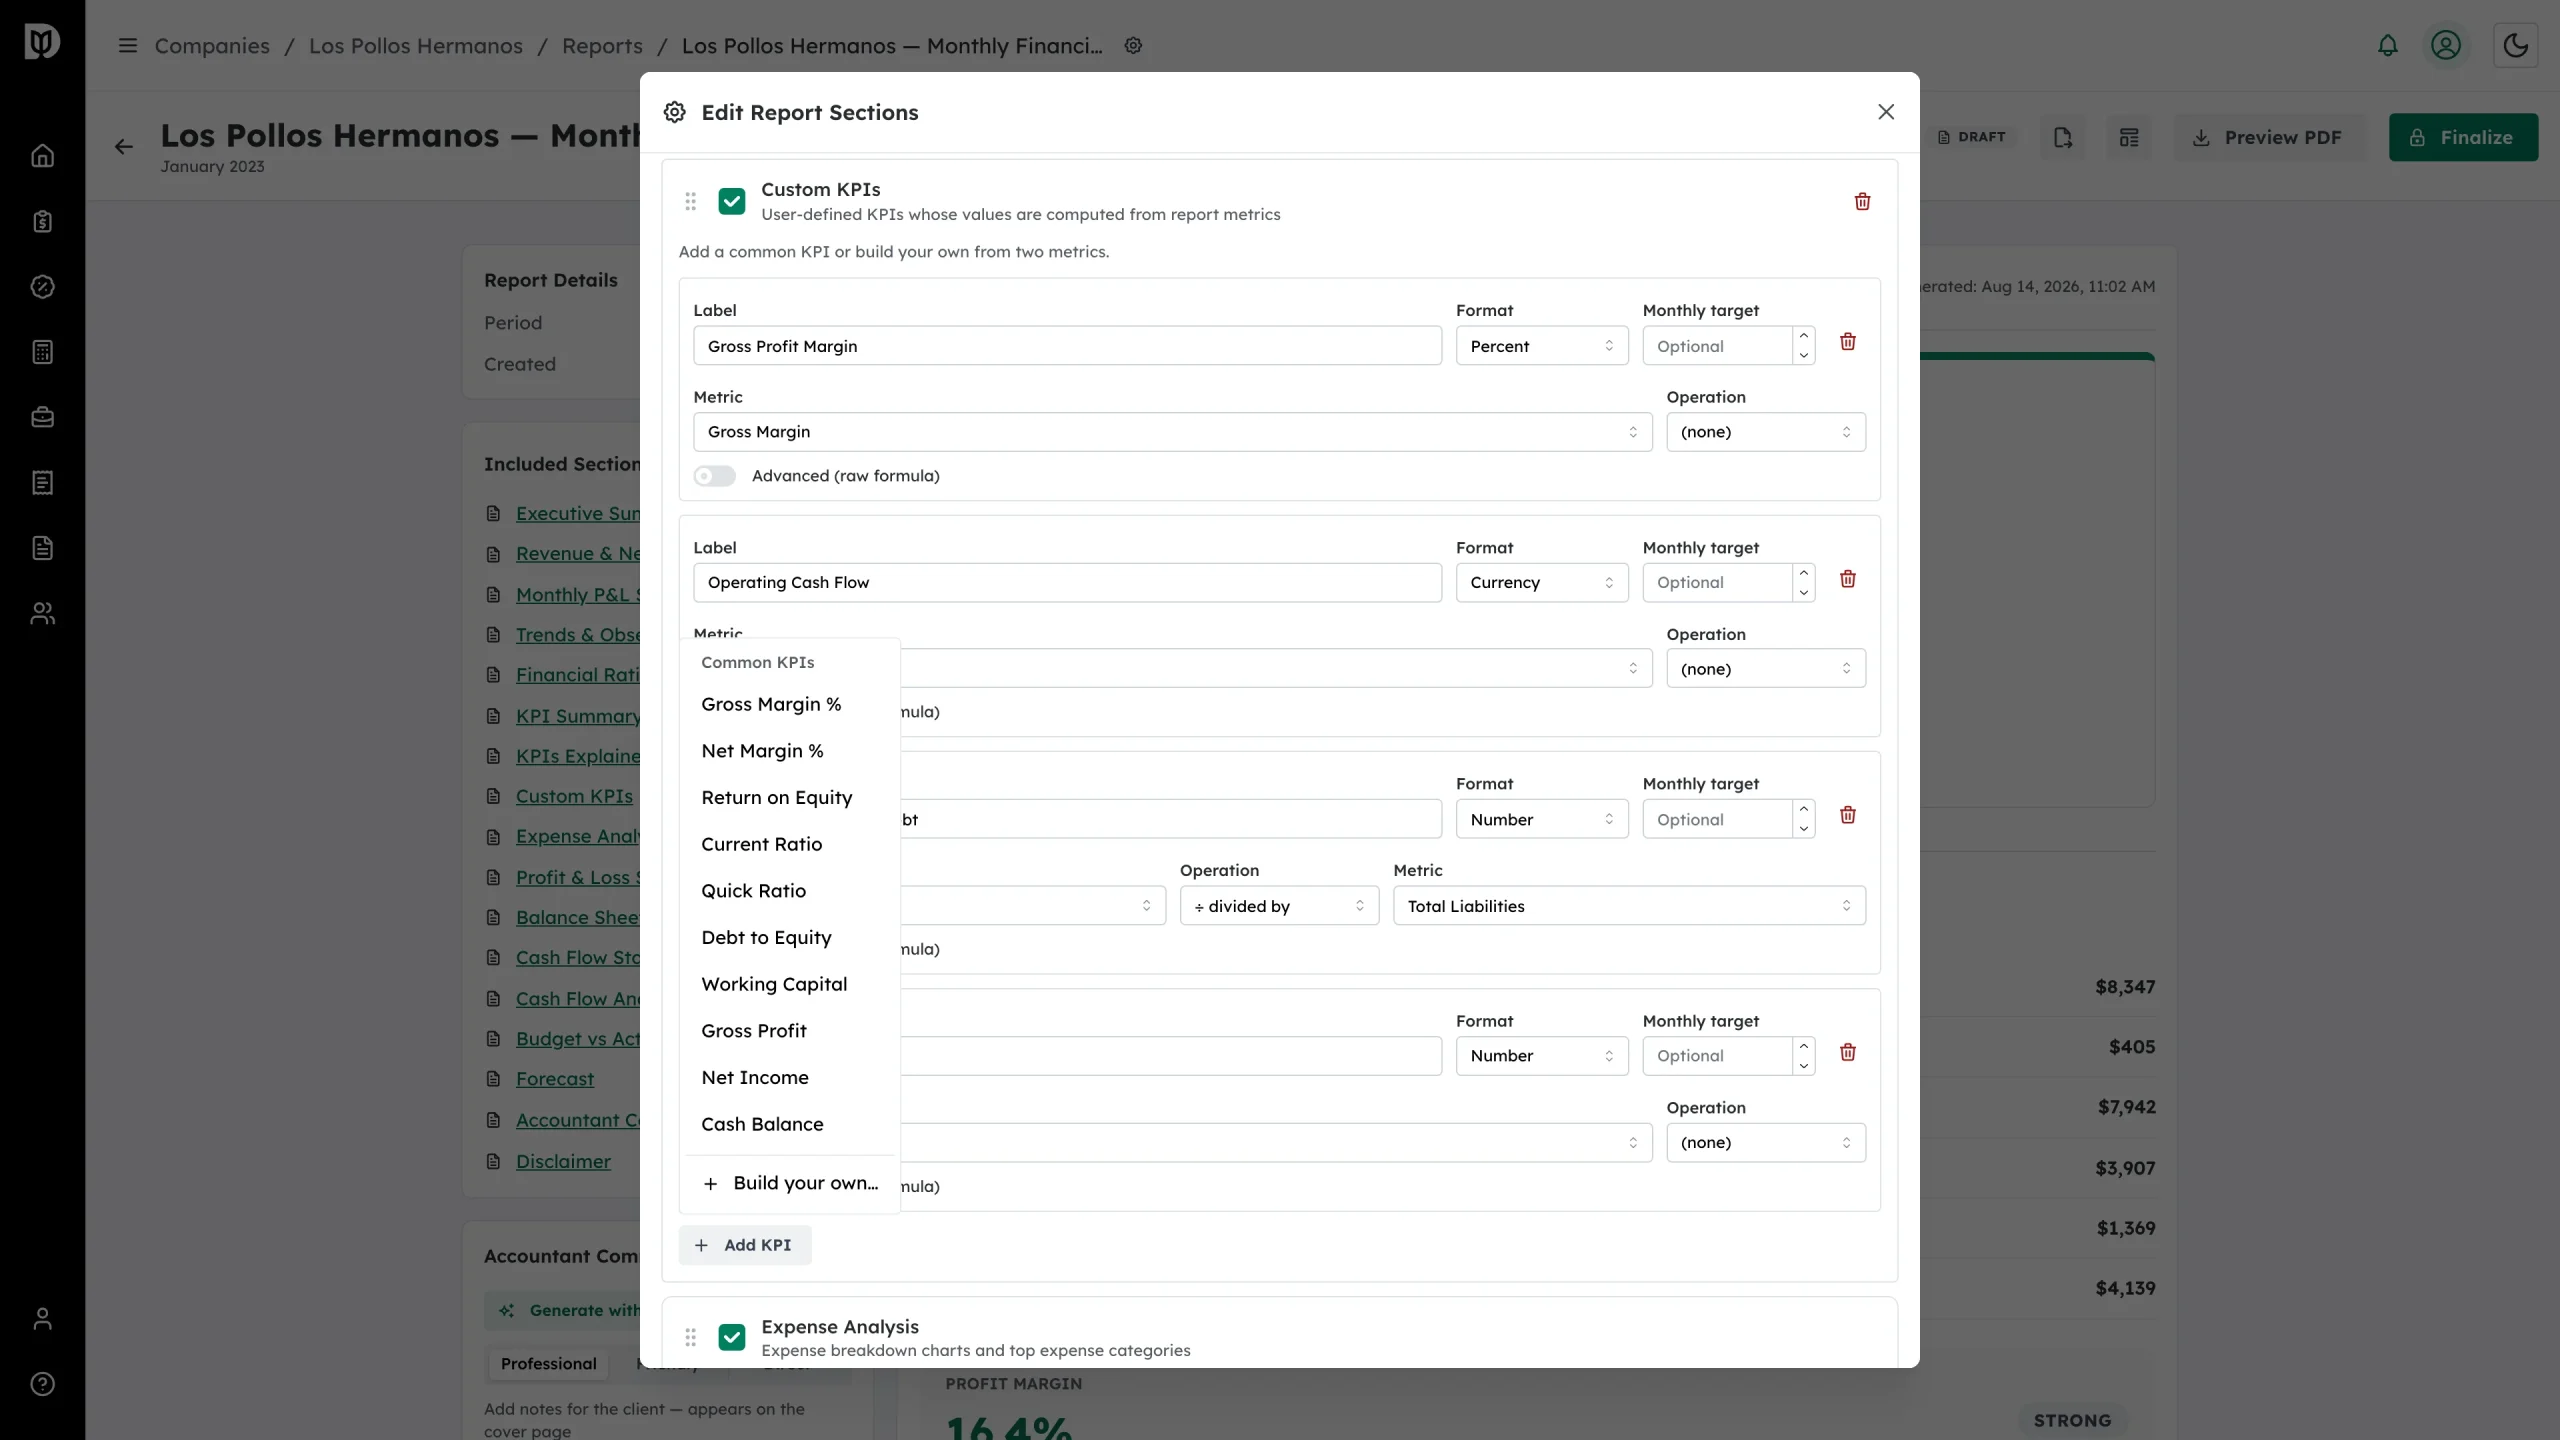
A row holds everything one KPI needs: its label, its format, an optional monthly target, and the metrics it is built from.
Step 3: Name the KPI
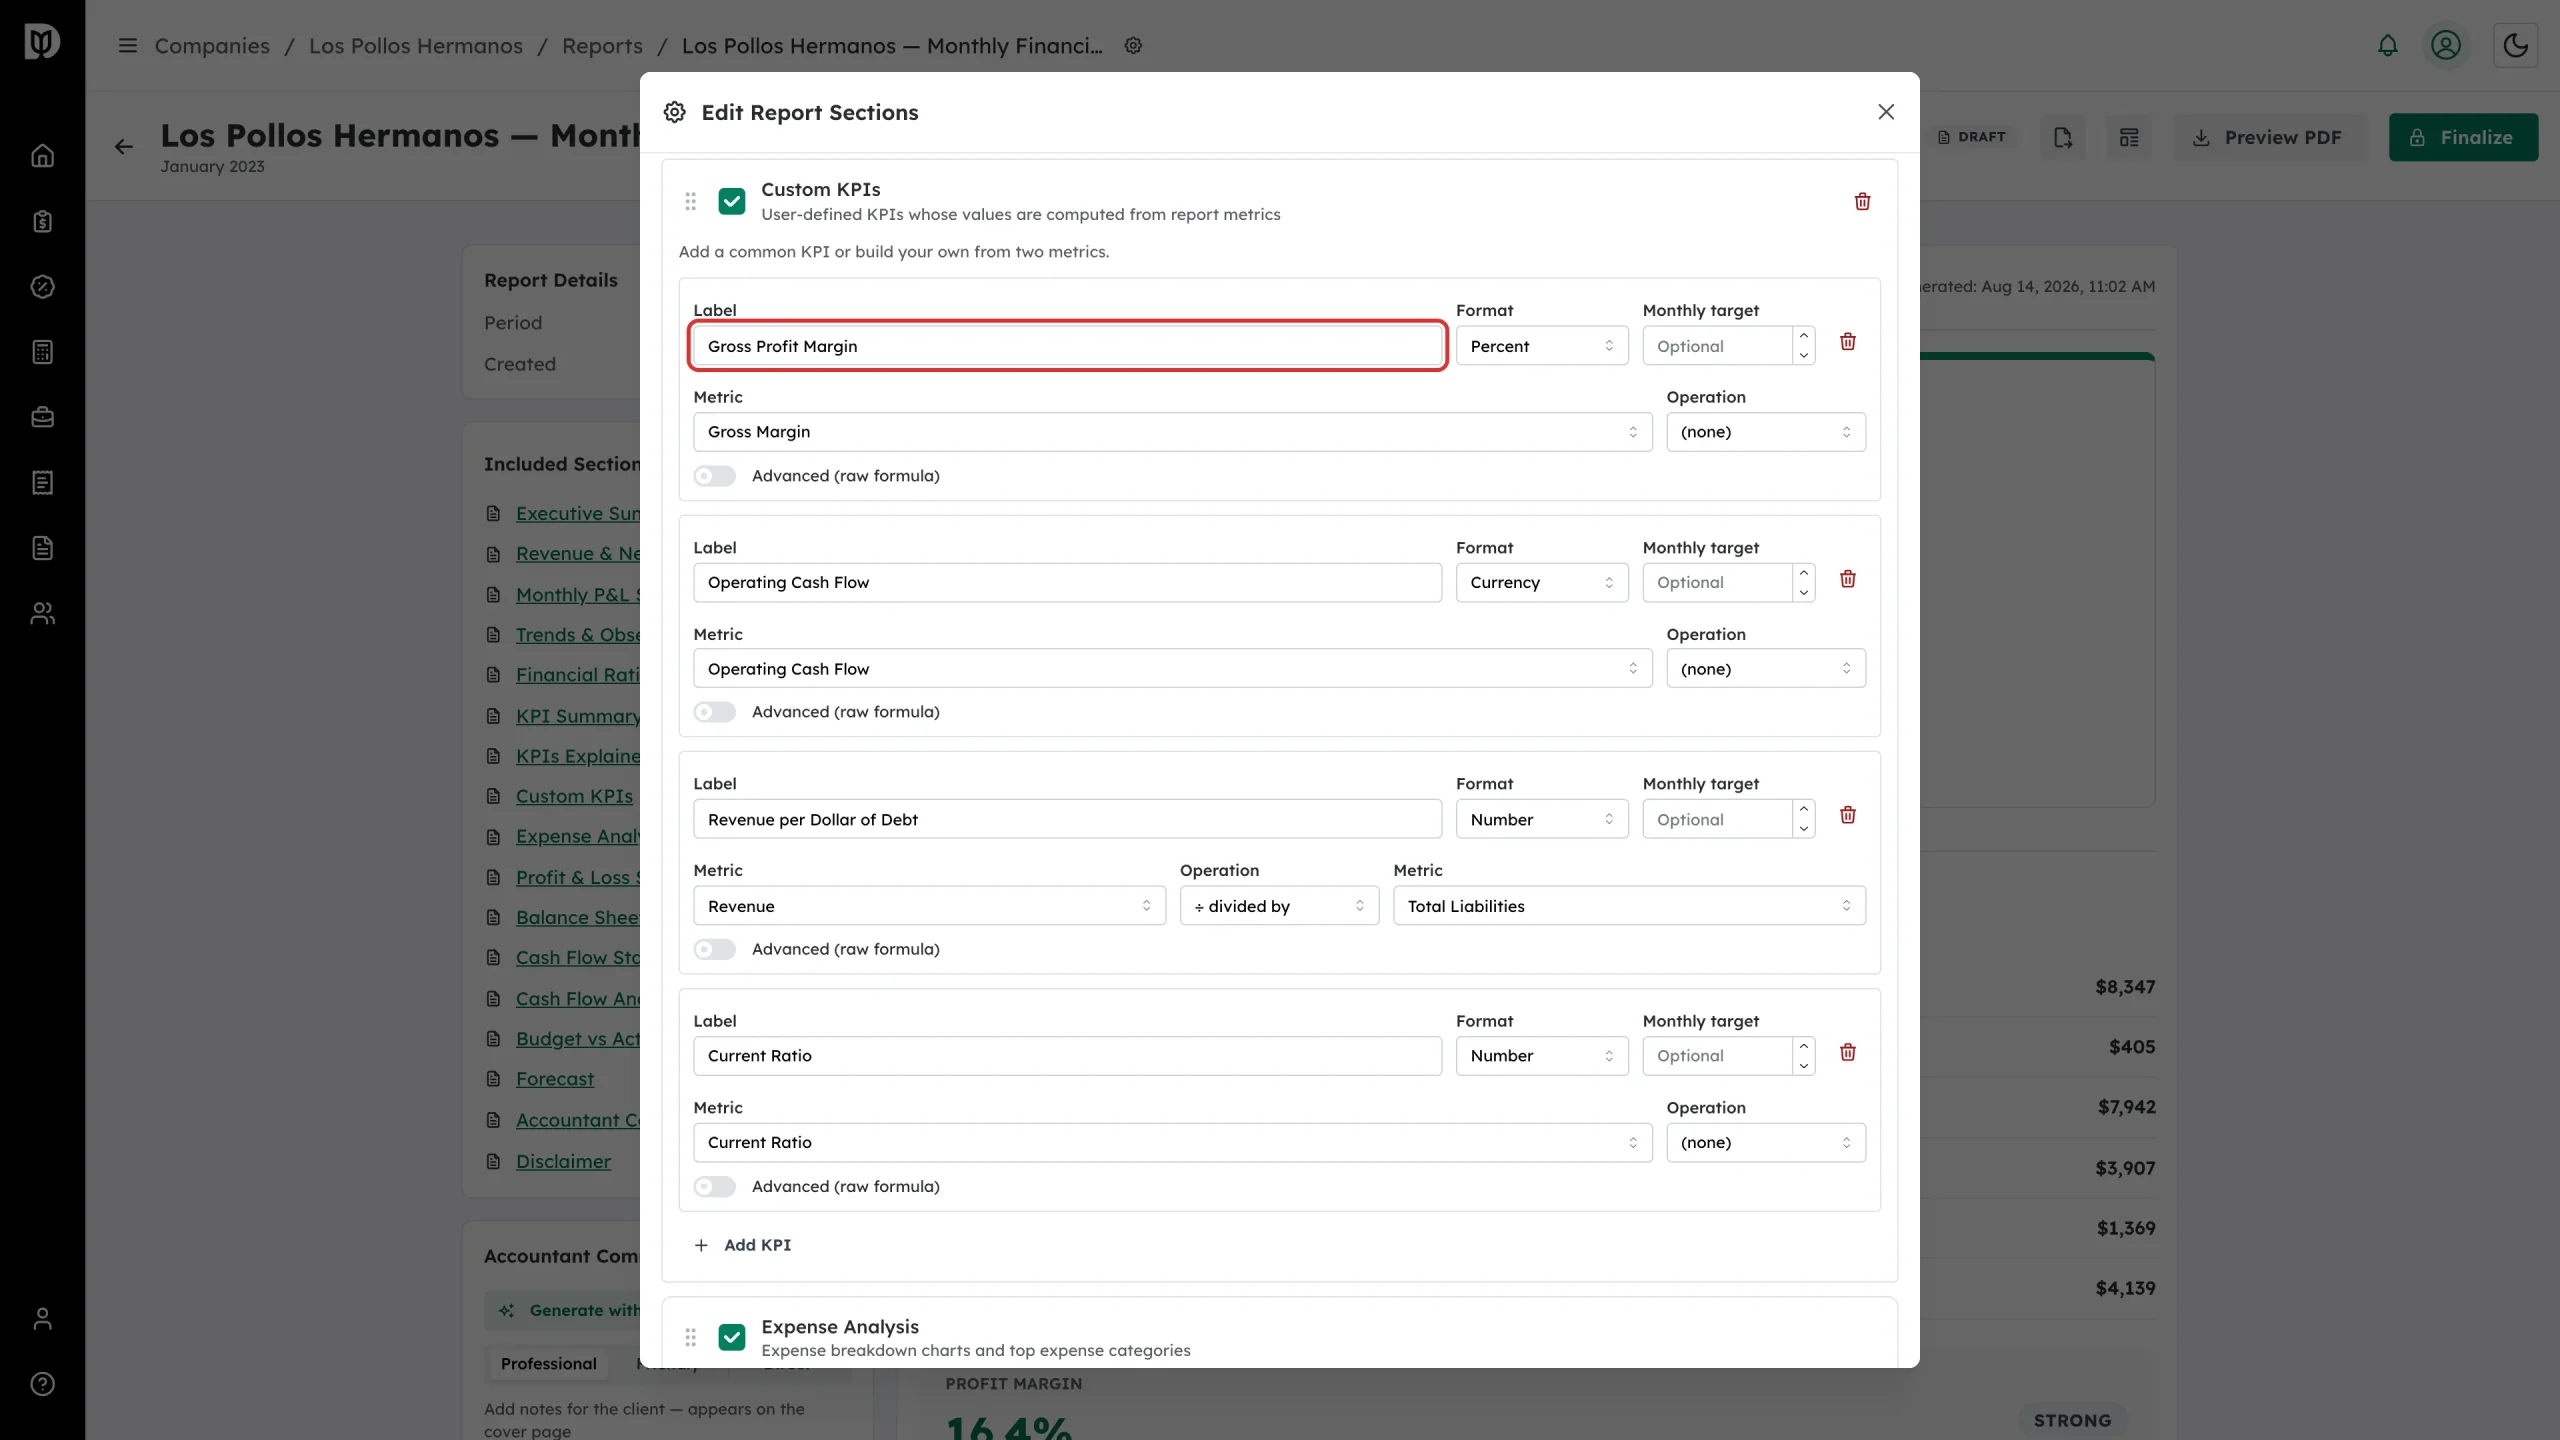
Enter a Label. This is the name your client reads in the report.
Step 4: Choose the value format
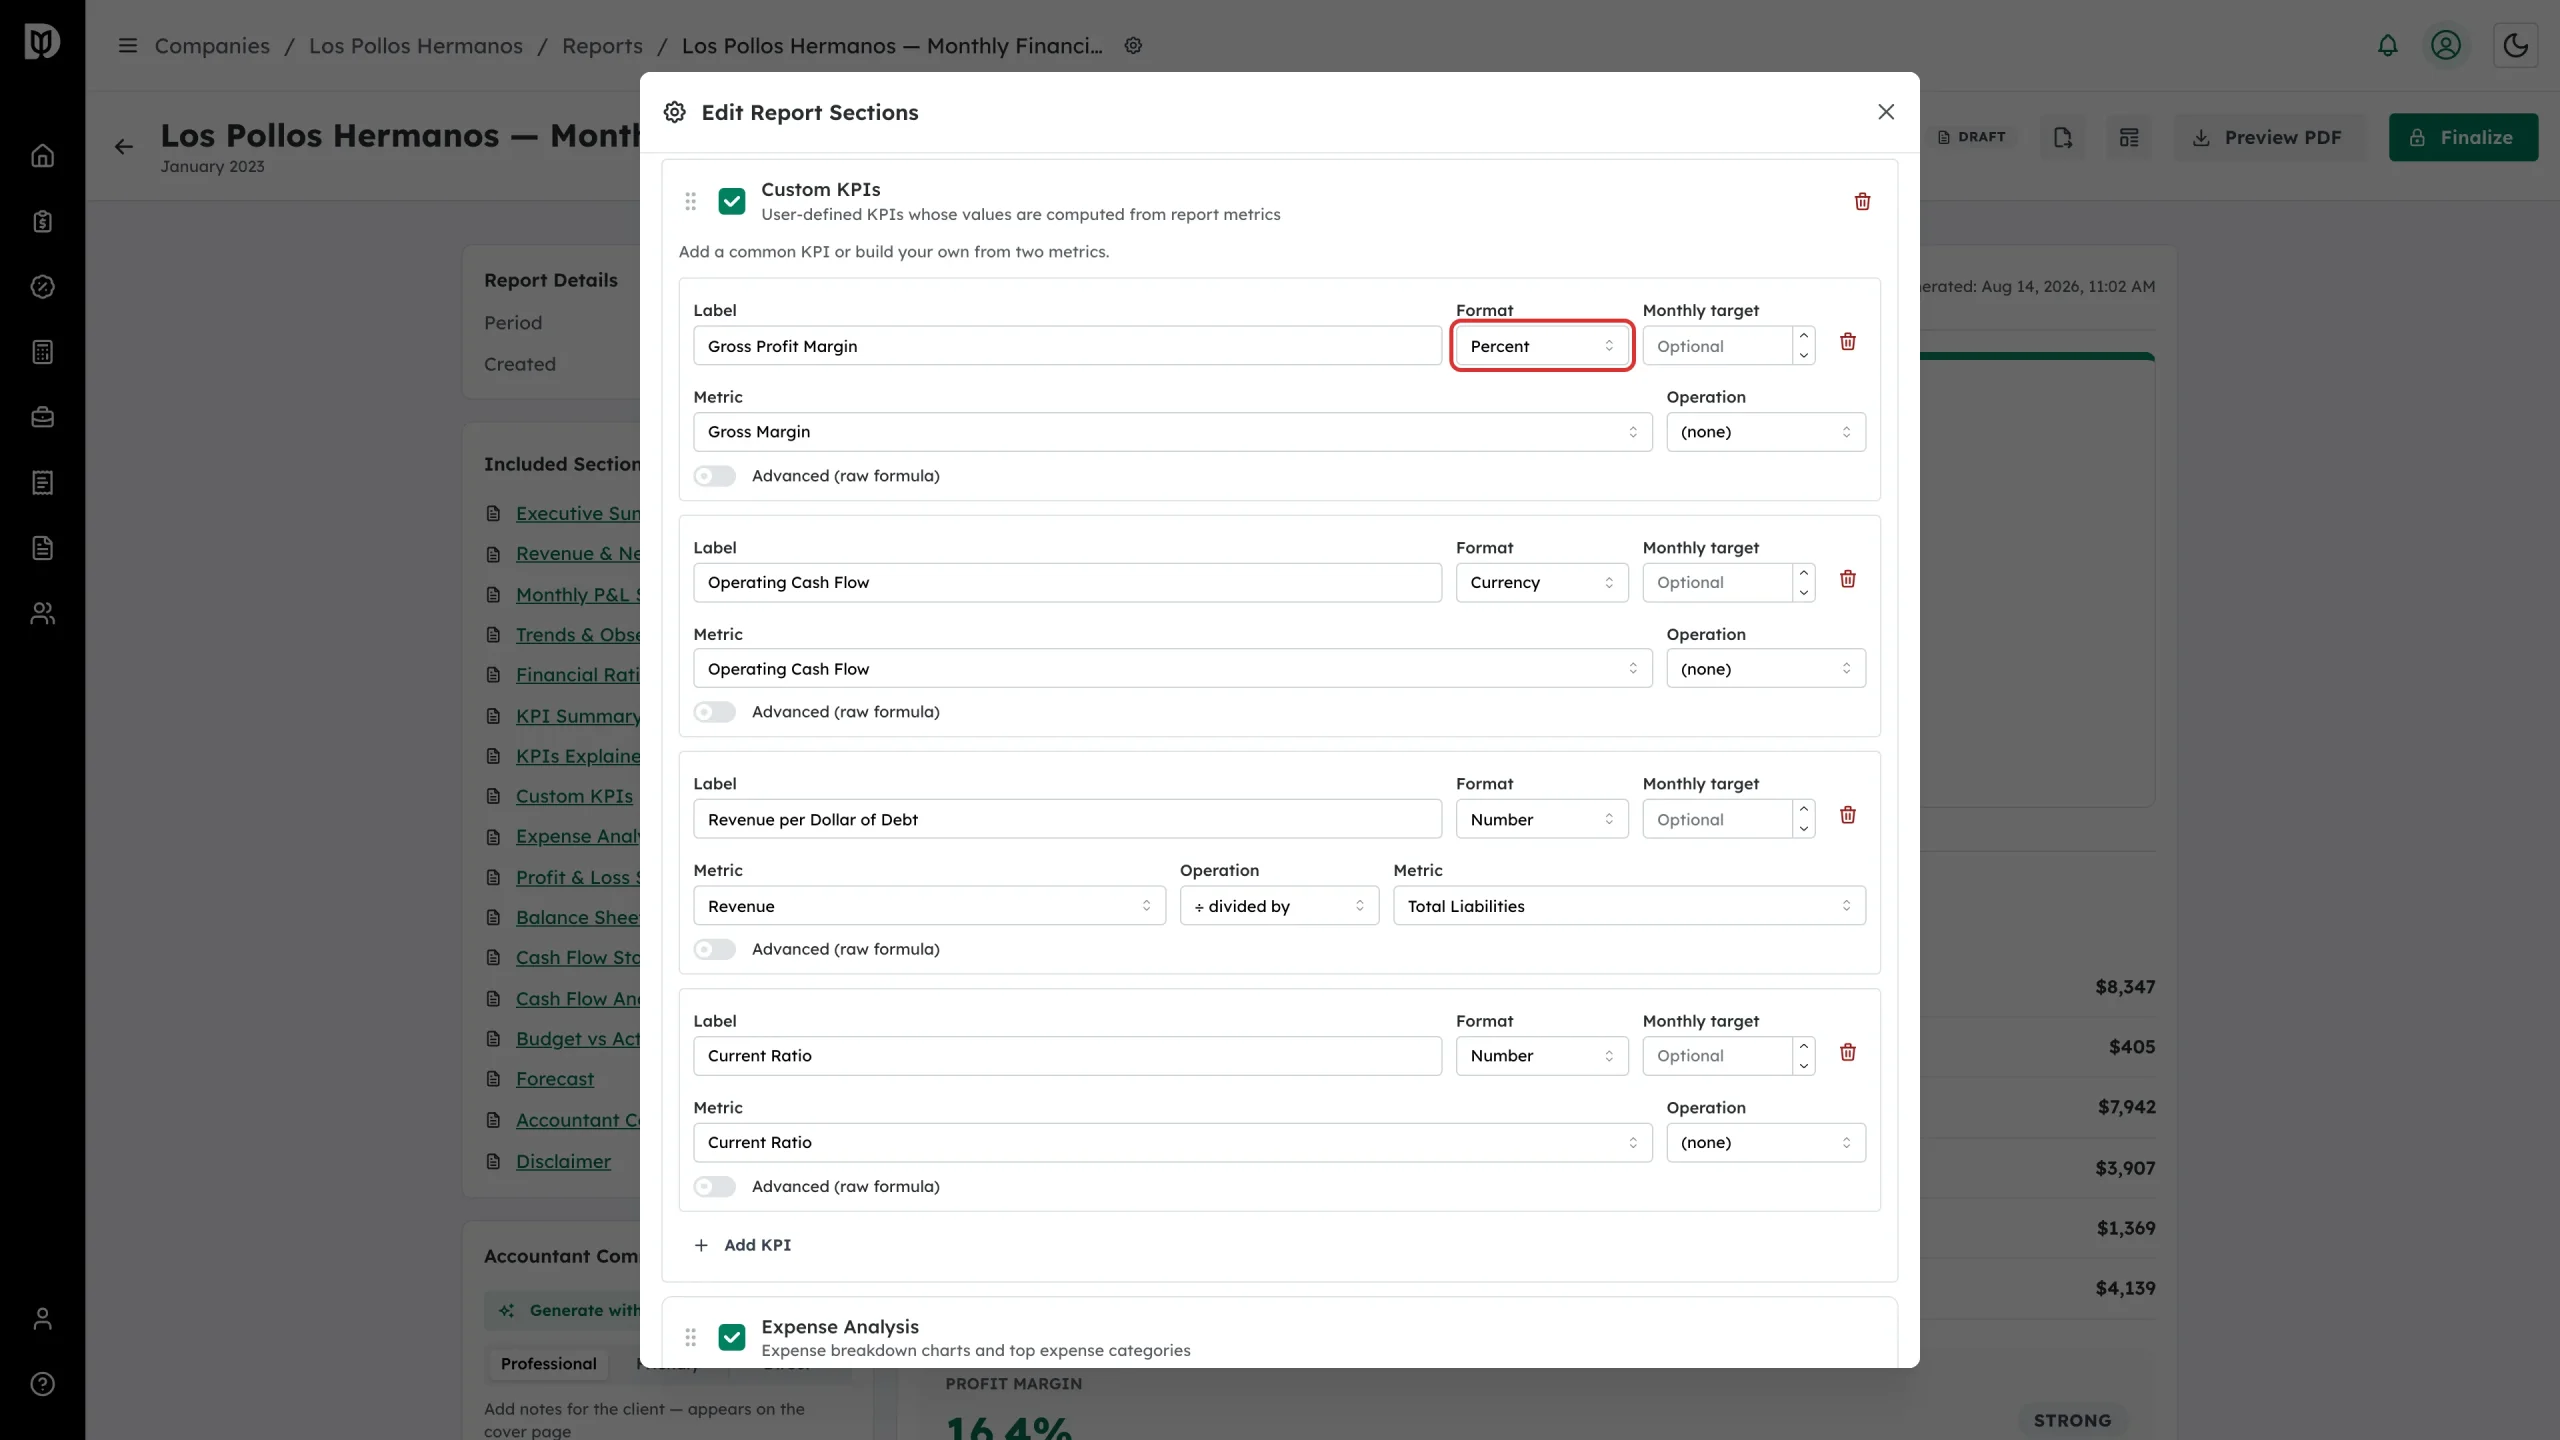
Set Format to Number, Currency or Percent so the value is displayed correctly.
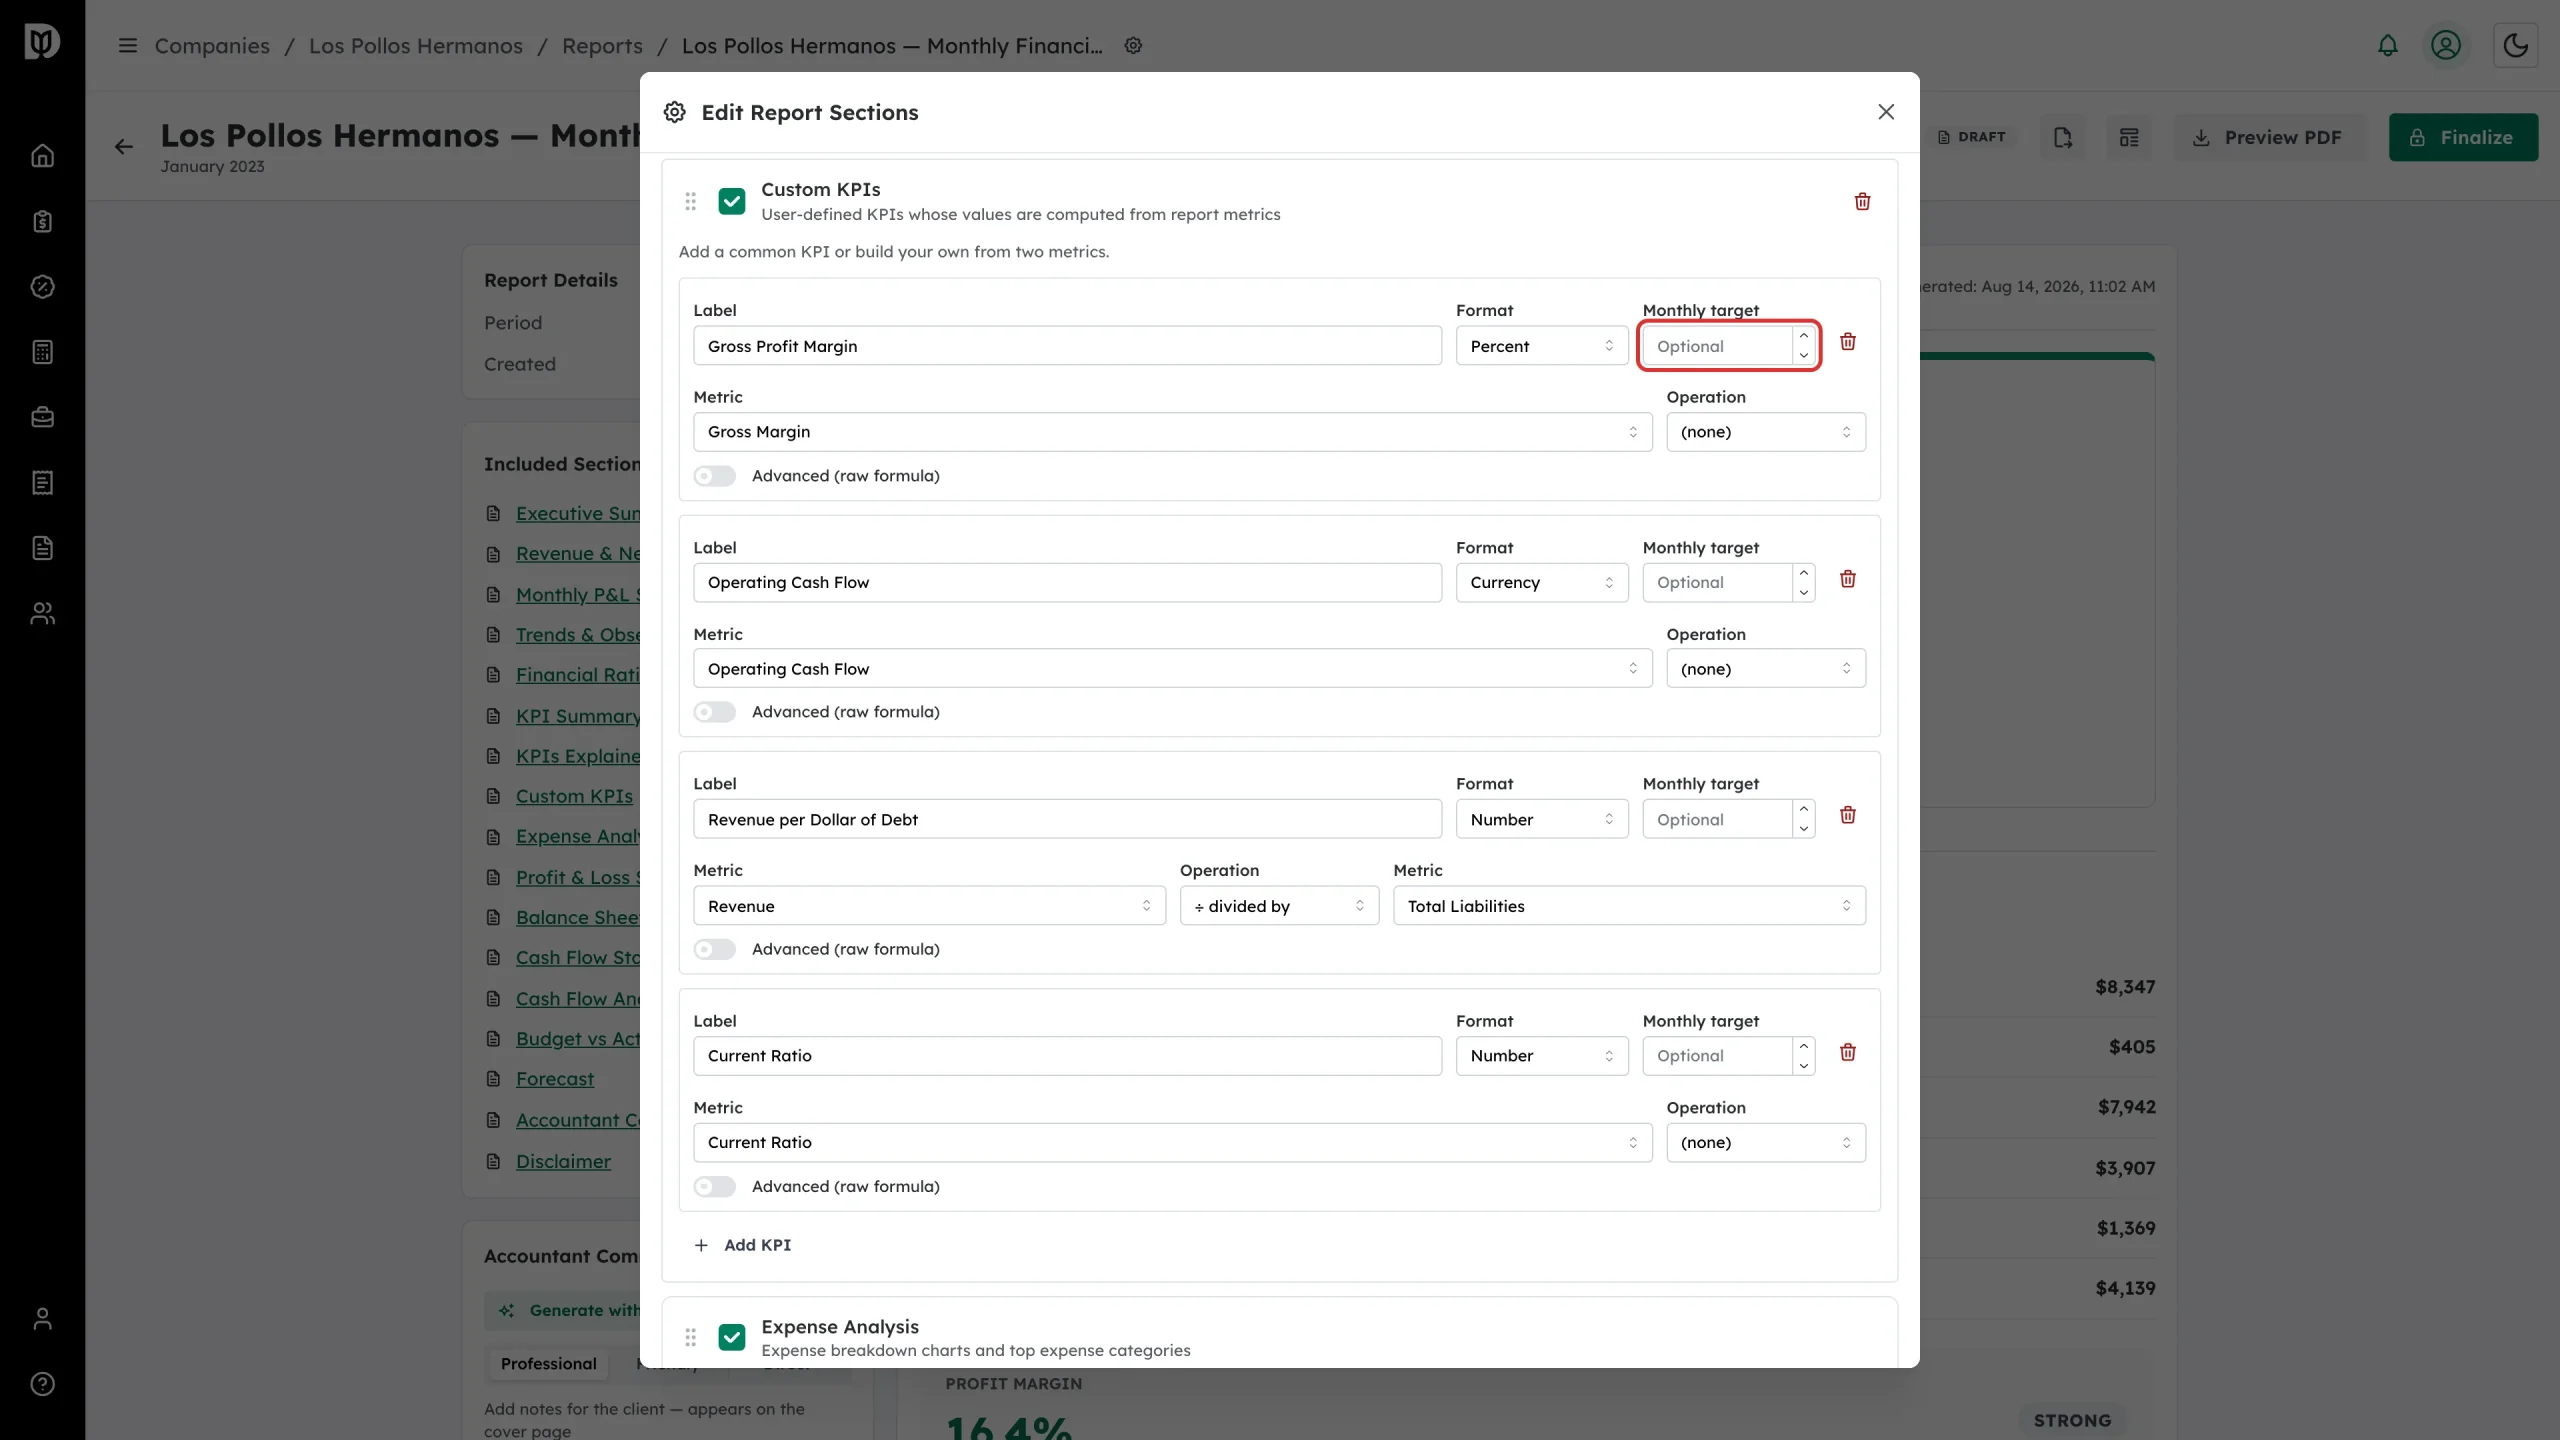
Step 5: Set a monthly target (optional)
Enter a Monthly target to score the KPI. When the report has live data you can select Suggest to start from the current period’s value.
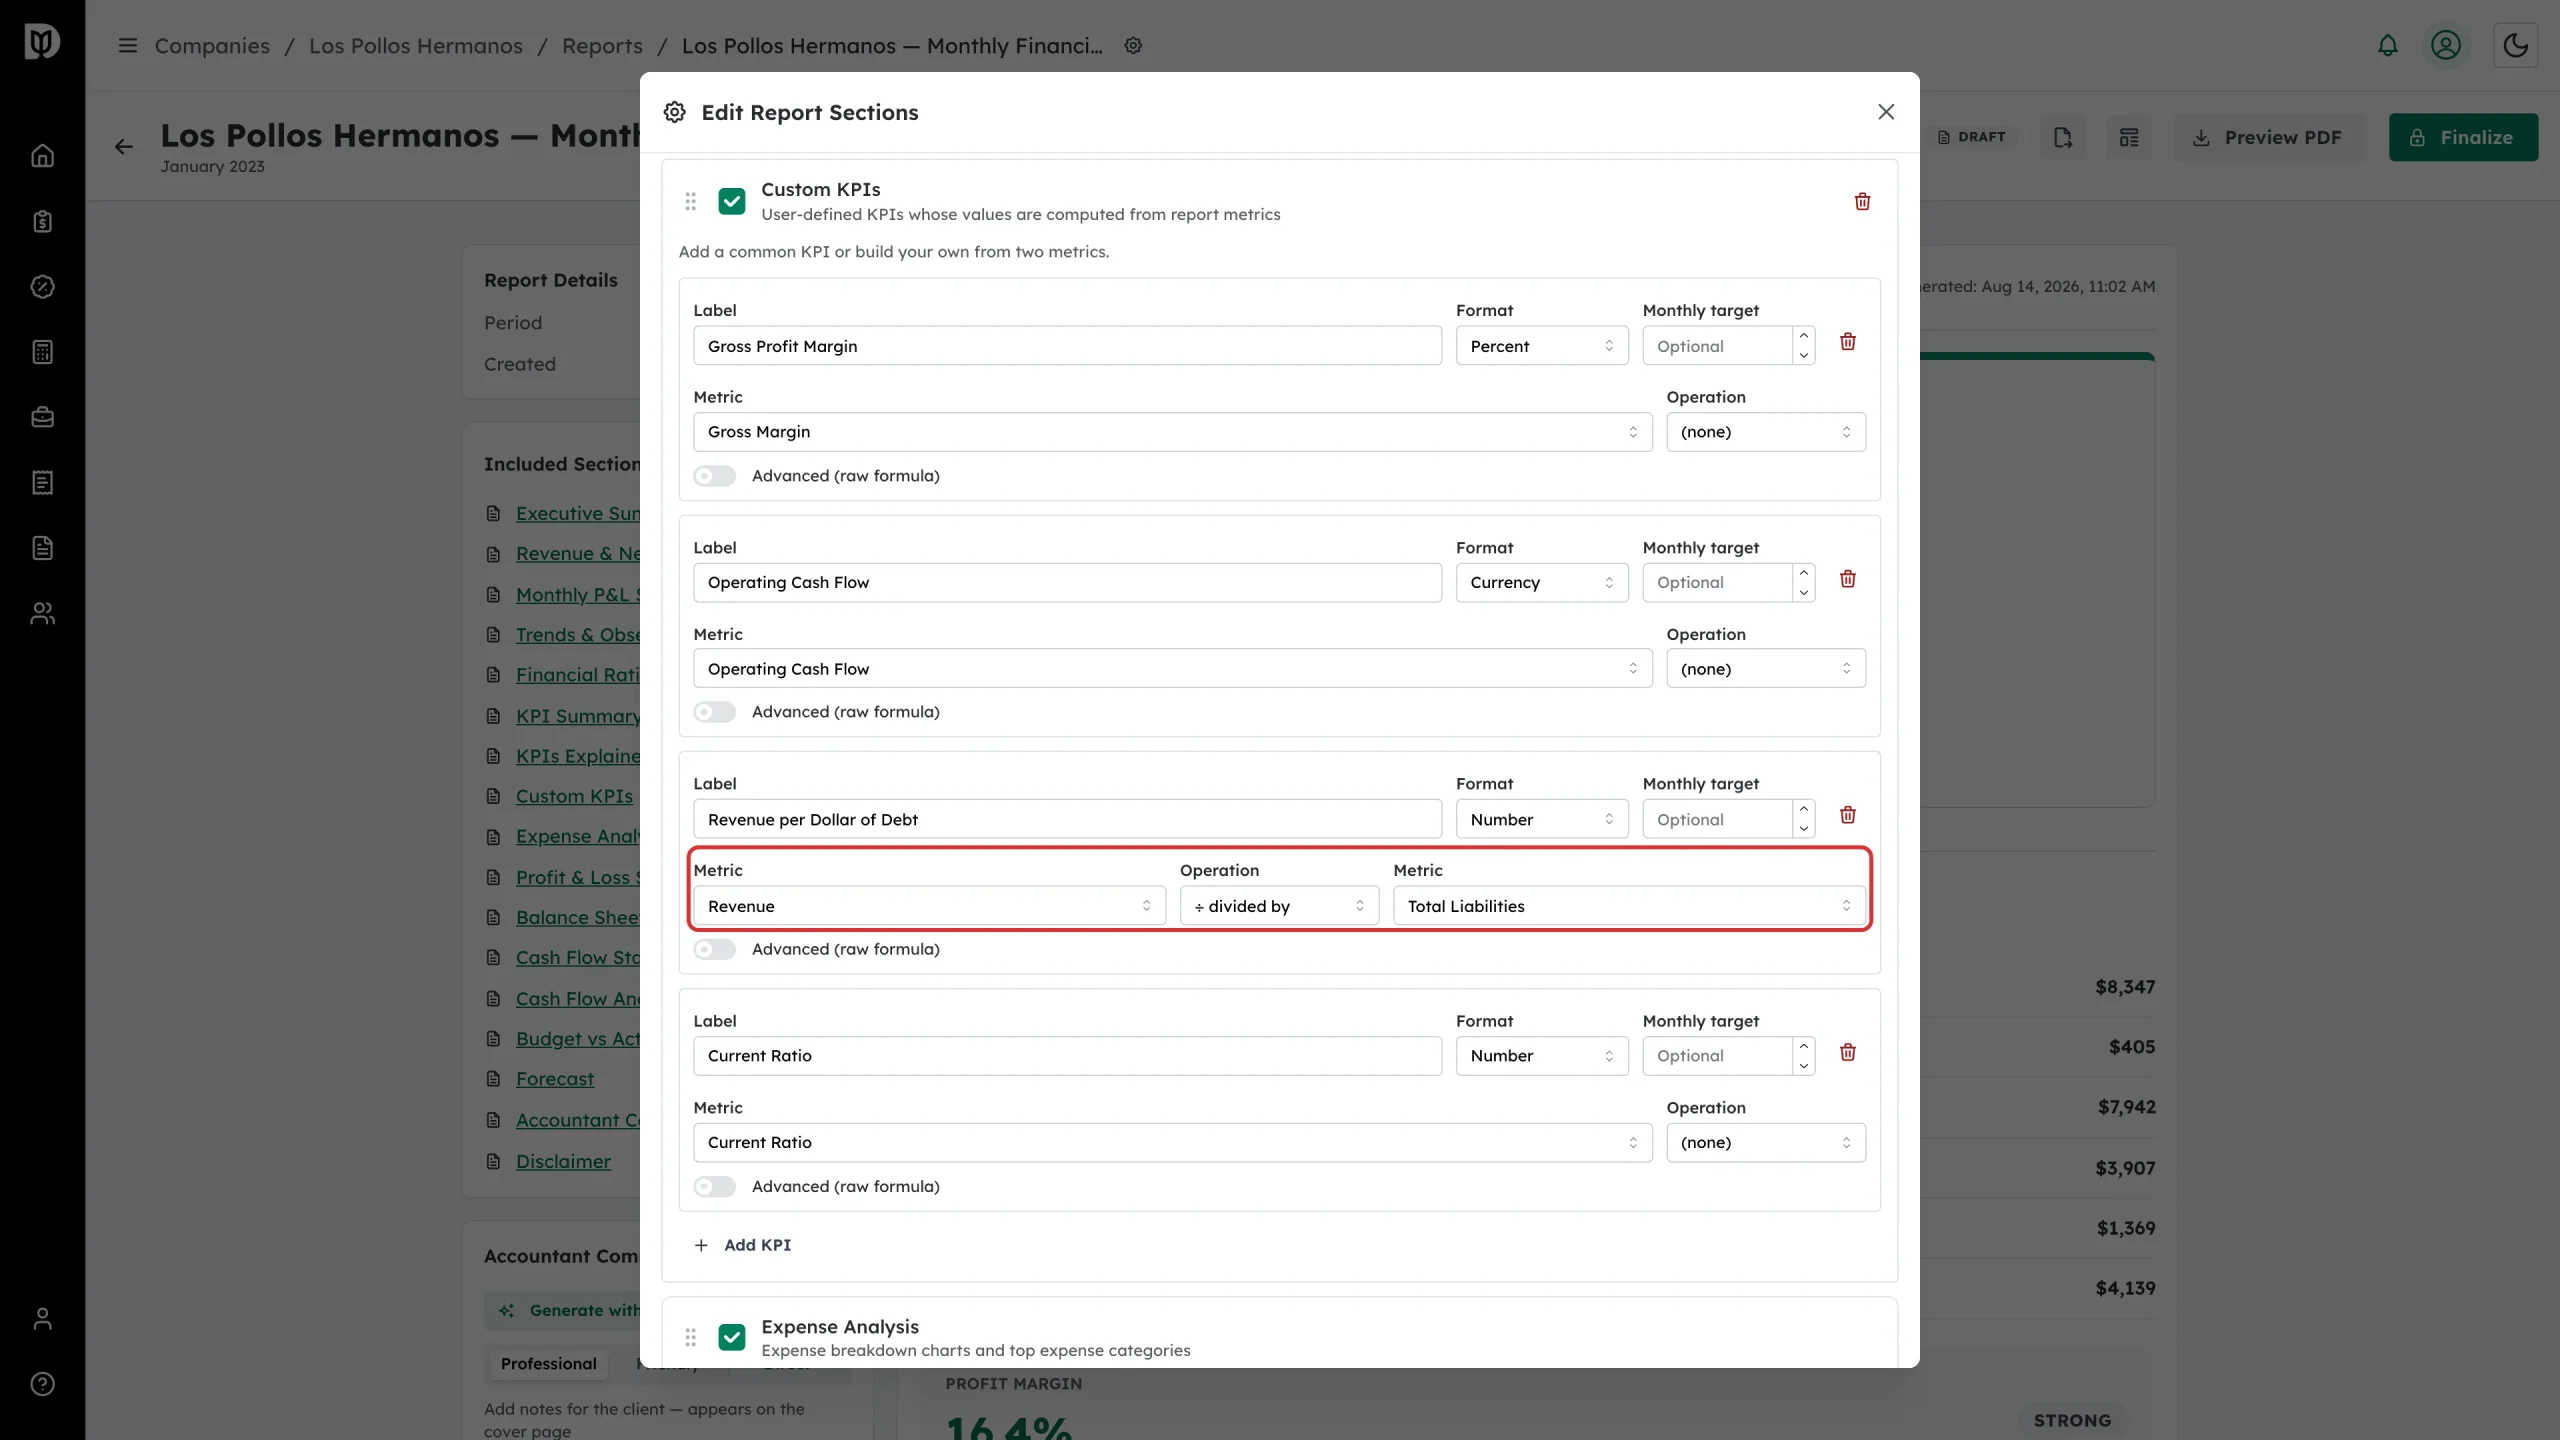
Step 6: Build the value
Use the guided picker: choose a Metric, an Operation, and a second metric — for example Revenue divided by Total Liabilities. Leave the operation as (none) to show a single metric on its own.
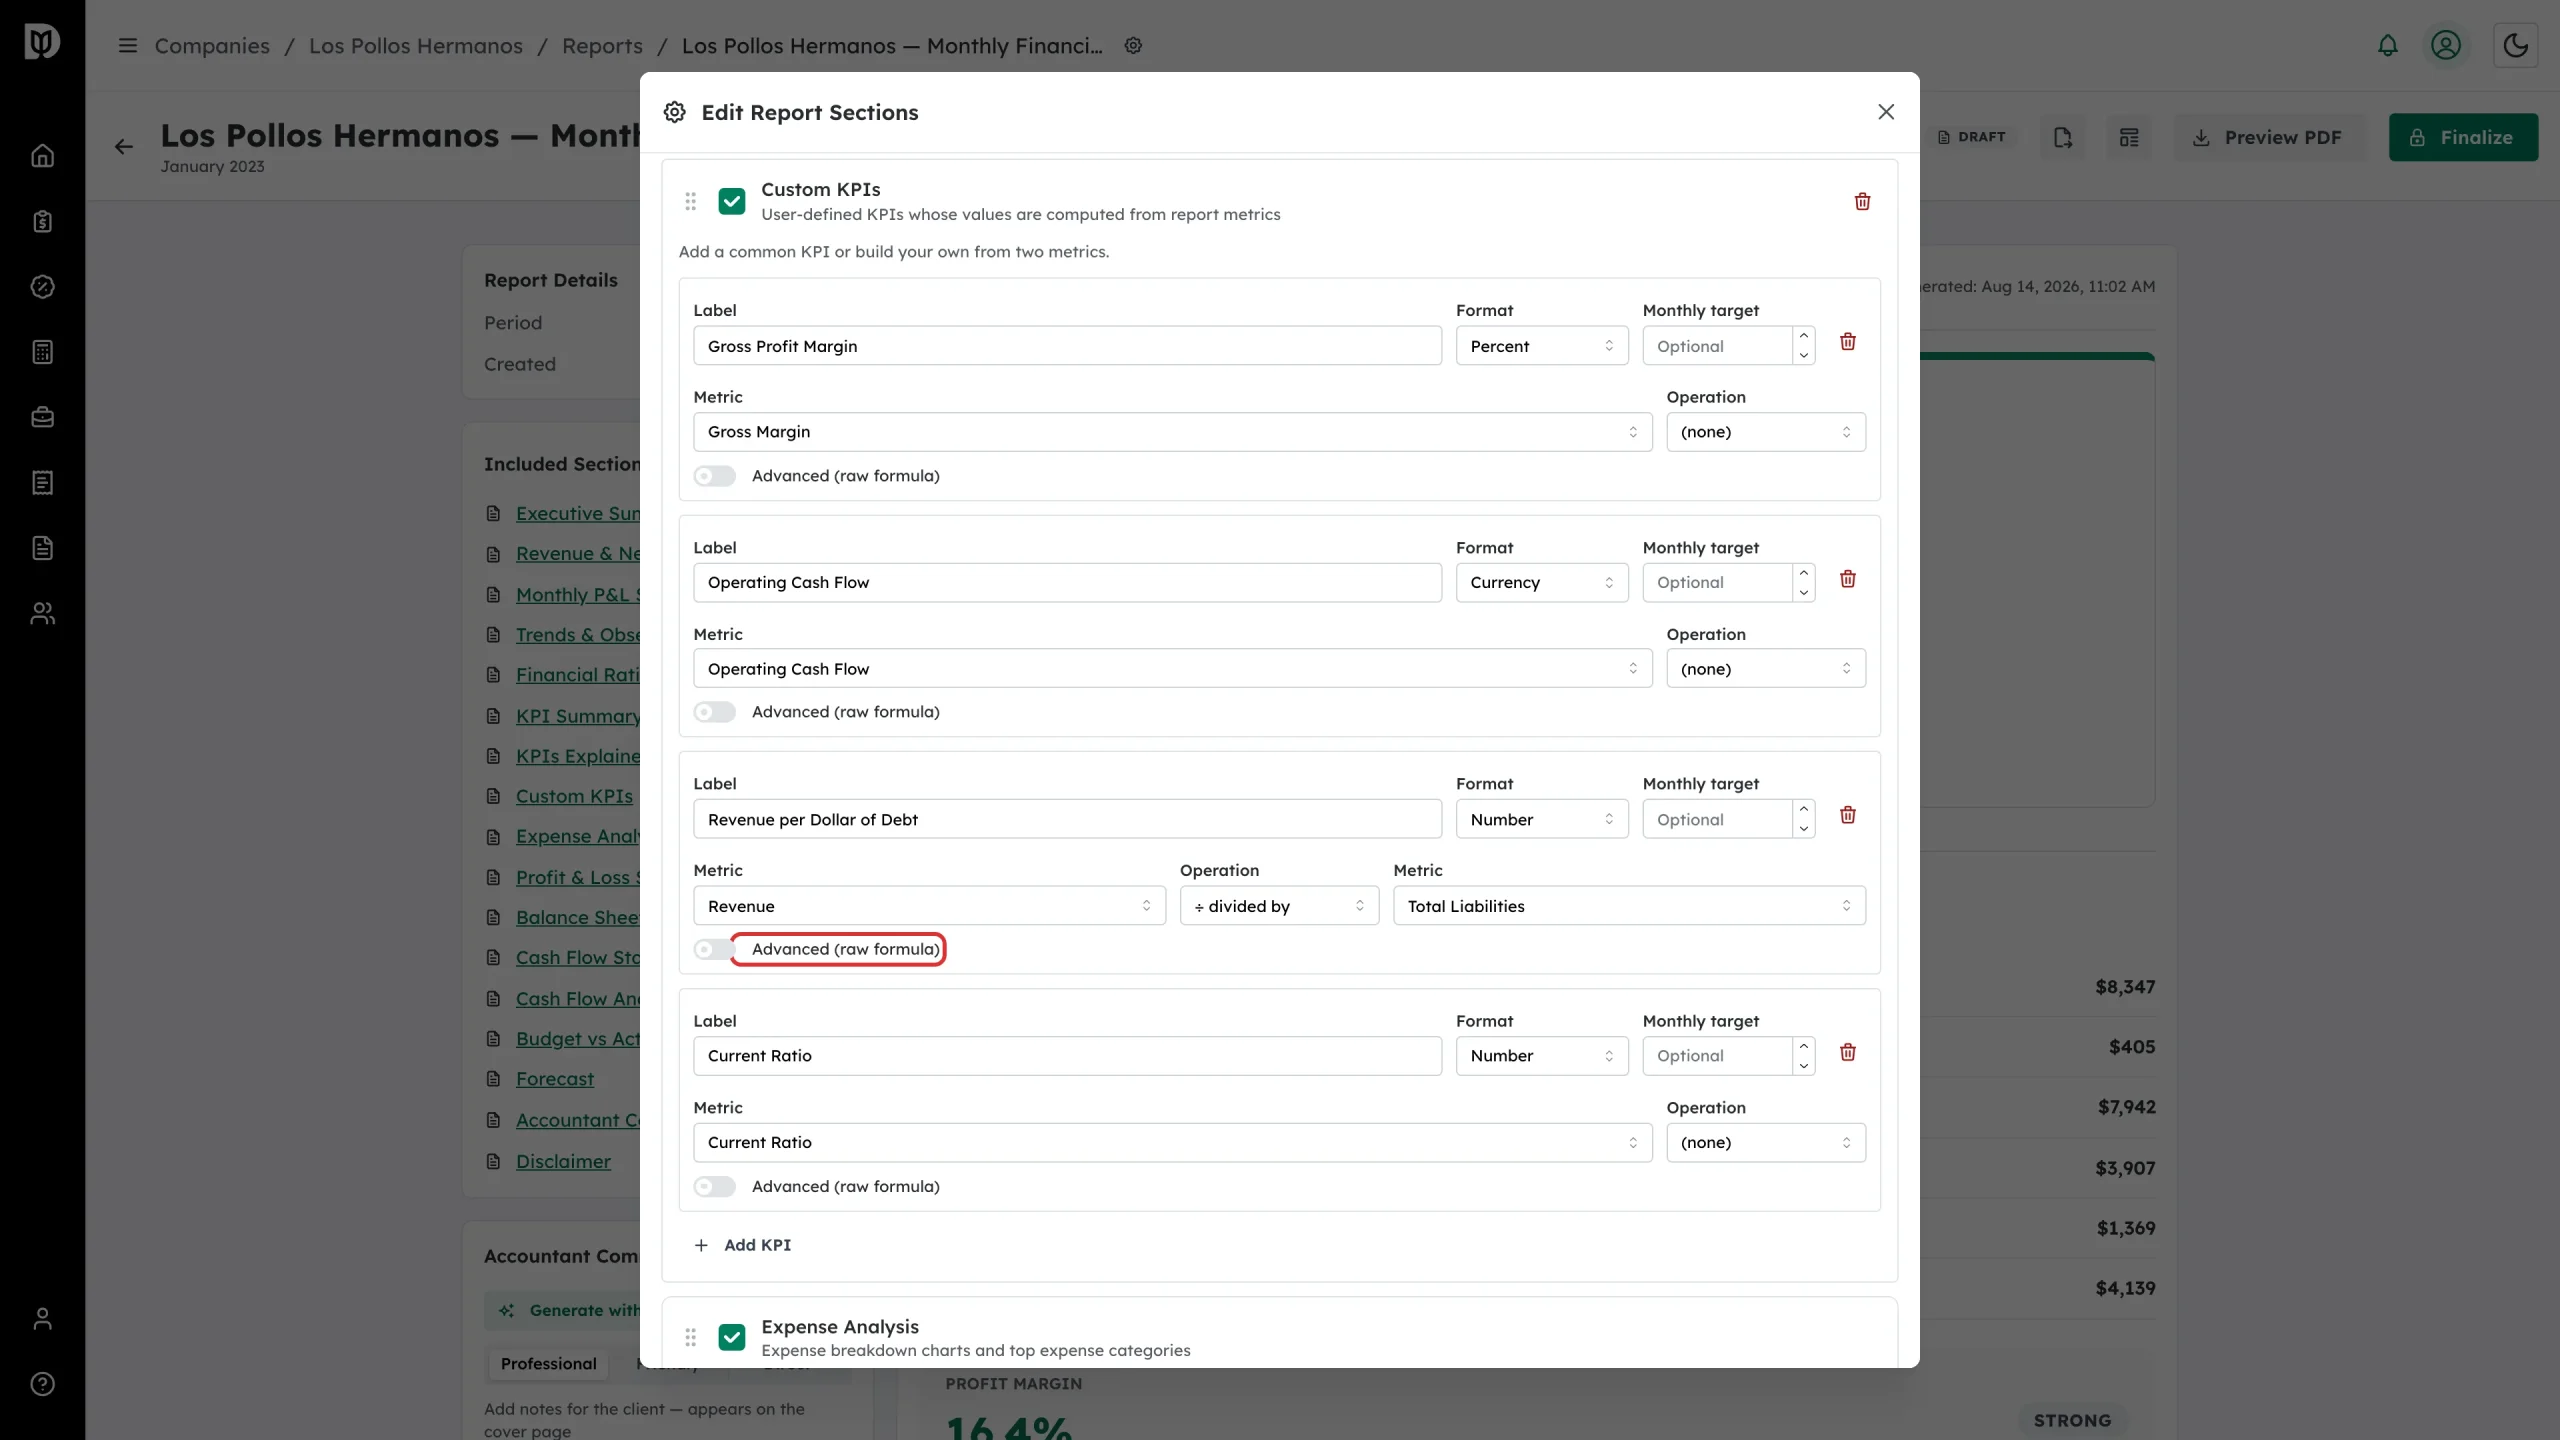
Step 7: Or write the formula yourself
Turn on Advanced (raw formula) to type a formula directly, such as revenue / expenses. Debits checks the formula as you type and flags anything it can’t read.
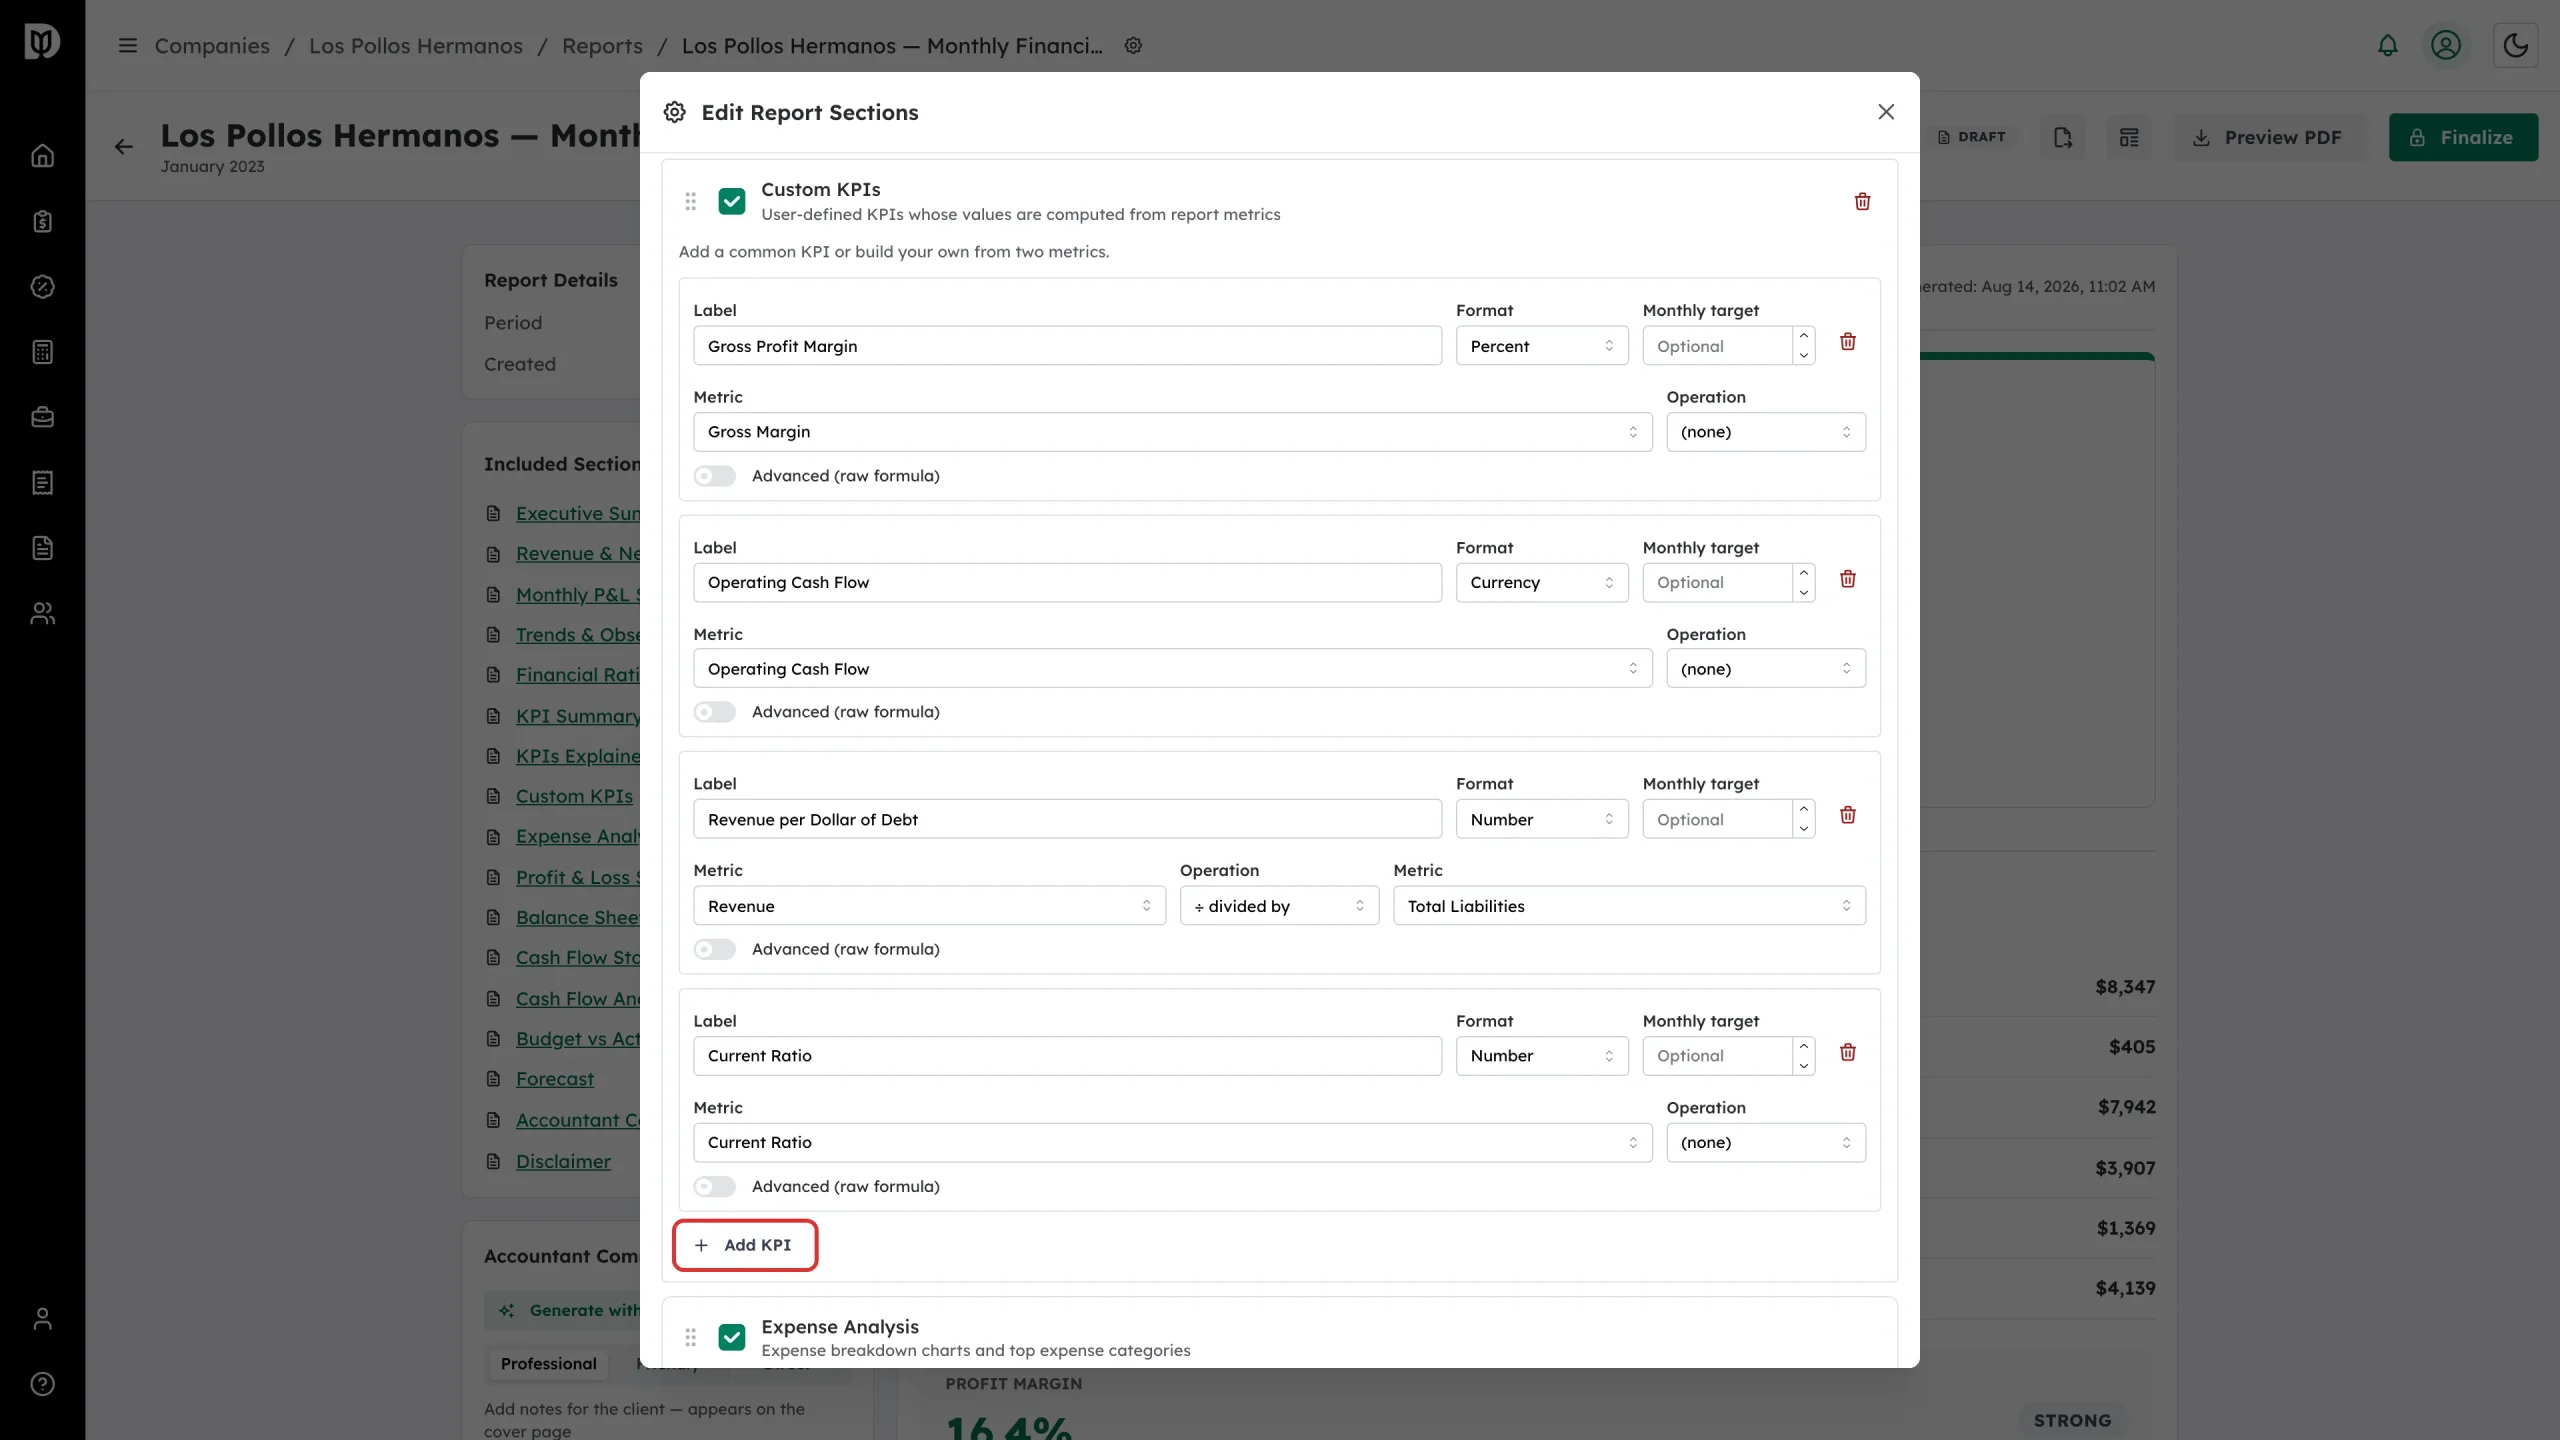
Step 8: Add another KPI
Select Add KPI at the bottom of the section.
Step 9: Start from a common KPI
Pick one of the common KPIs — Gross Margin %, Net Margin %, Return on Equity, Current Ratio, Quick Ratio, Debt to Equity, Working Capital, Gross Profit, Net Income or Cash Balance — or choose Build your own… for a blank row.
What happens next
Save your changes. Custom KPIs render in the report’s Custom KPIs section, can also be added to the KPI Summary scorecard, and are captured in the snapshot when you finalize. When the report has live data for the period, each row shows the value the KPI will carry so you can check the formula before finalizing.
Troubleshooting
- A KPI shows a dash. The formula divided by zero, or a value it needs isn’t available for the period. Debits shows a dash rather than an error.
- You can’t save. Fix any formula flagged in red — only valid formulas can be saved.
- No live value is shown. The report has no live QuickBooks figures for the period, so there is nothing to evaluate the formula against yet.