

Who this is for: Reviewers and senior bookkeepers checking period-over-period changes before signing off a close.
What you’ll learn: How to compare this period to the prior period on the profit and loss and balance sheet, and spot flagged variances.
Before you begin #
- Open the client’s Month End tab and select the Flux Analysis tab.
- Flux Analysis reads live financials, so the client should be connected to QuickBooks.
Step-by-step instructions #
Step 1: Choose a report #
Switch between Profit & Loss and Balance Sheet. Each account shows its current amount, prior amount, dollar change, and percent change. Large swings are flagged automatically.
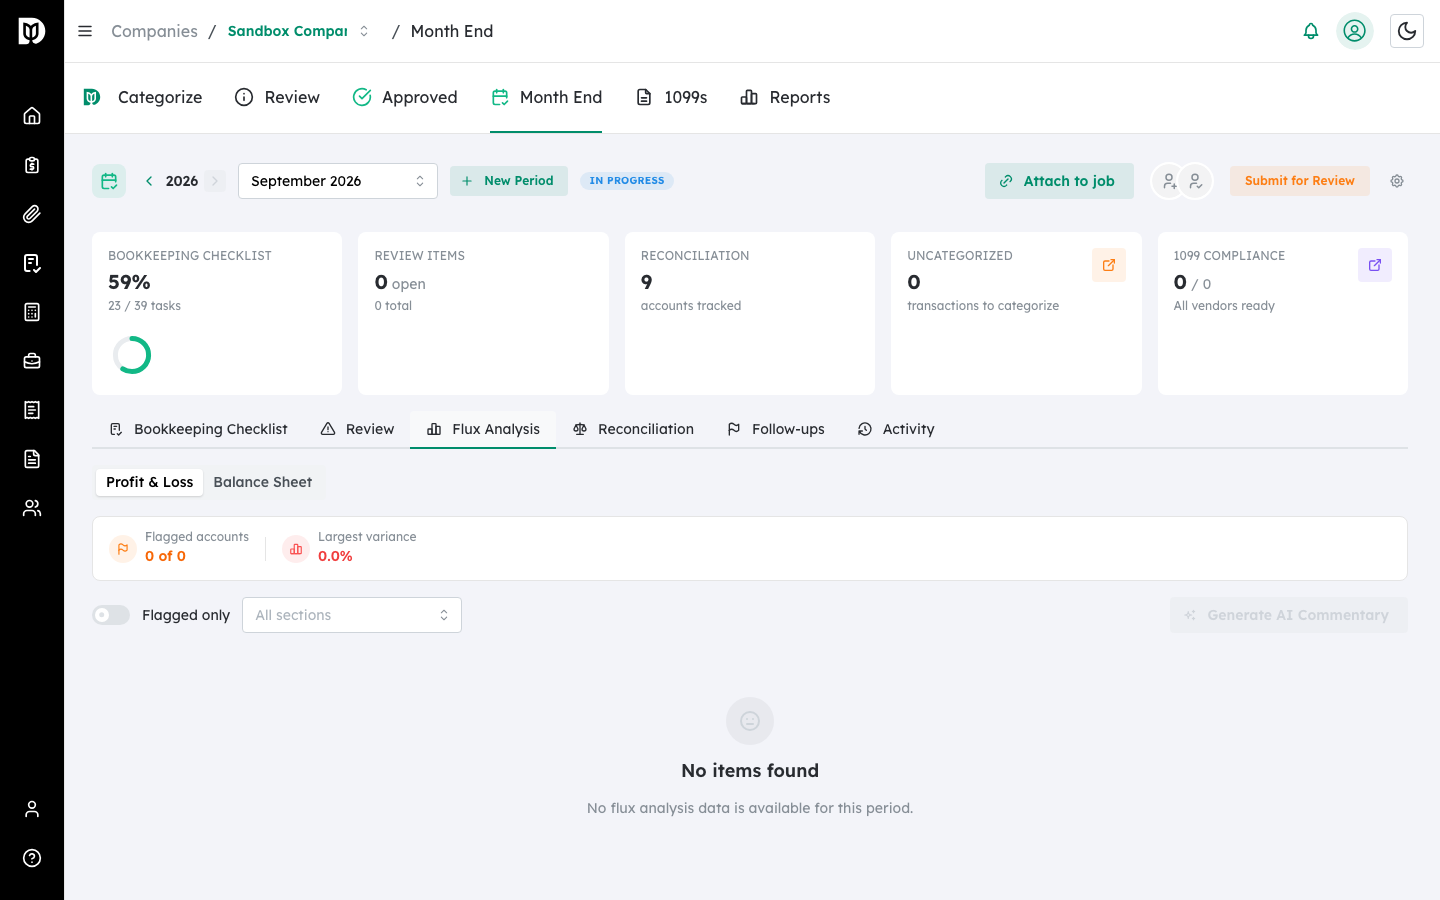
Note: If the client has no QuickBooks connection or prior-period data yet, this tab shows No flux analysis data is available for this period. Connect the client and complete a prior close to populate the comparison.
Step 2: Focus on flagged accounts #
Turn on Flagged only to show just the accounts with notable variances, or use the section filter to narrow the view.
Step 3: Add commentary #
Use Generate AI Commentary to draft an explanation for the variances, then edit and save it so it is captured with the close.
What happens next #
Flux commentary is saved to the period and can be included when you deliver the close to the client. Use it to explain unusual movements before final sign-off.
Troubleshooting #
- Problem: No flux data appears. Flux Analysis needs a live QuickBooks connection and prior-period data. Confirm the client is connected and that a prior period exists.


