Who this is for: Accountants deciding which sections to include when building a report.
What you’ll learn: What every report section shows, so you can assemble the right report for each client.
Before you begin
- Sections are chosen in Edit Report Sections and can be reordered freely.
- You don’t need every section — a bookkeeping client might get a Simple P&L while a fractional-CFO client gets the full pack.
- Every report covers one company and one period.
Statements and summaries
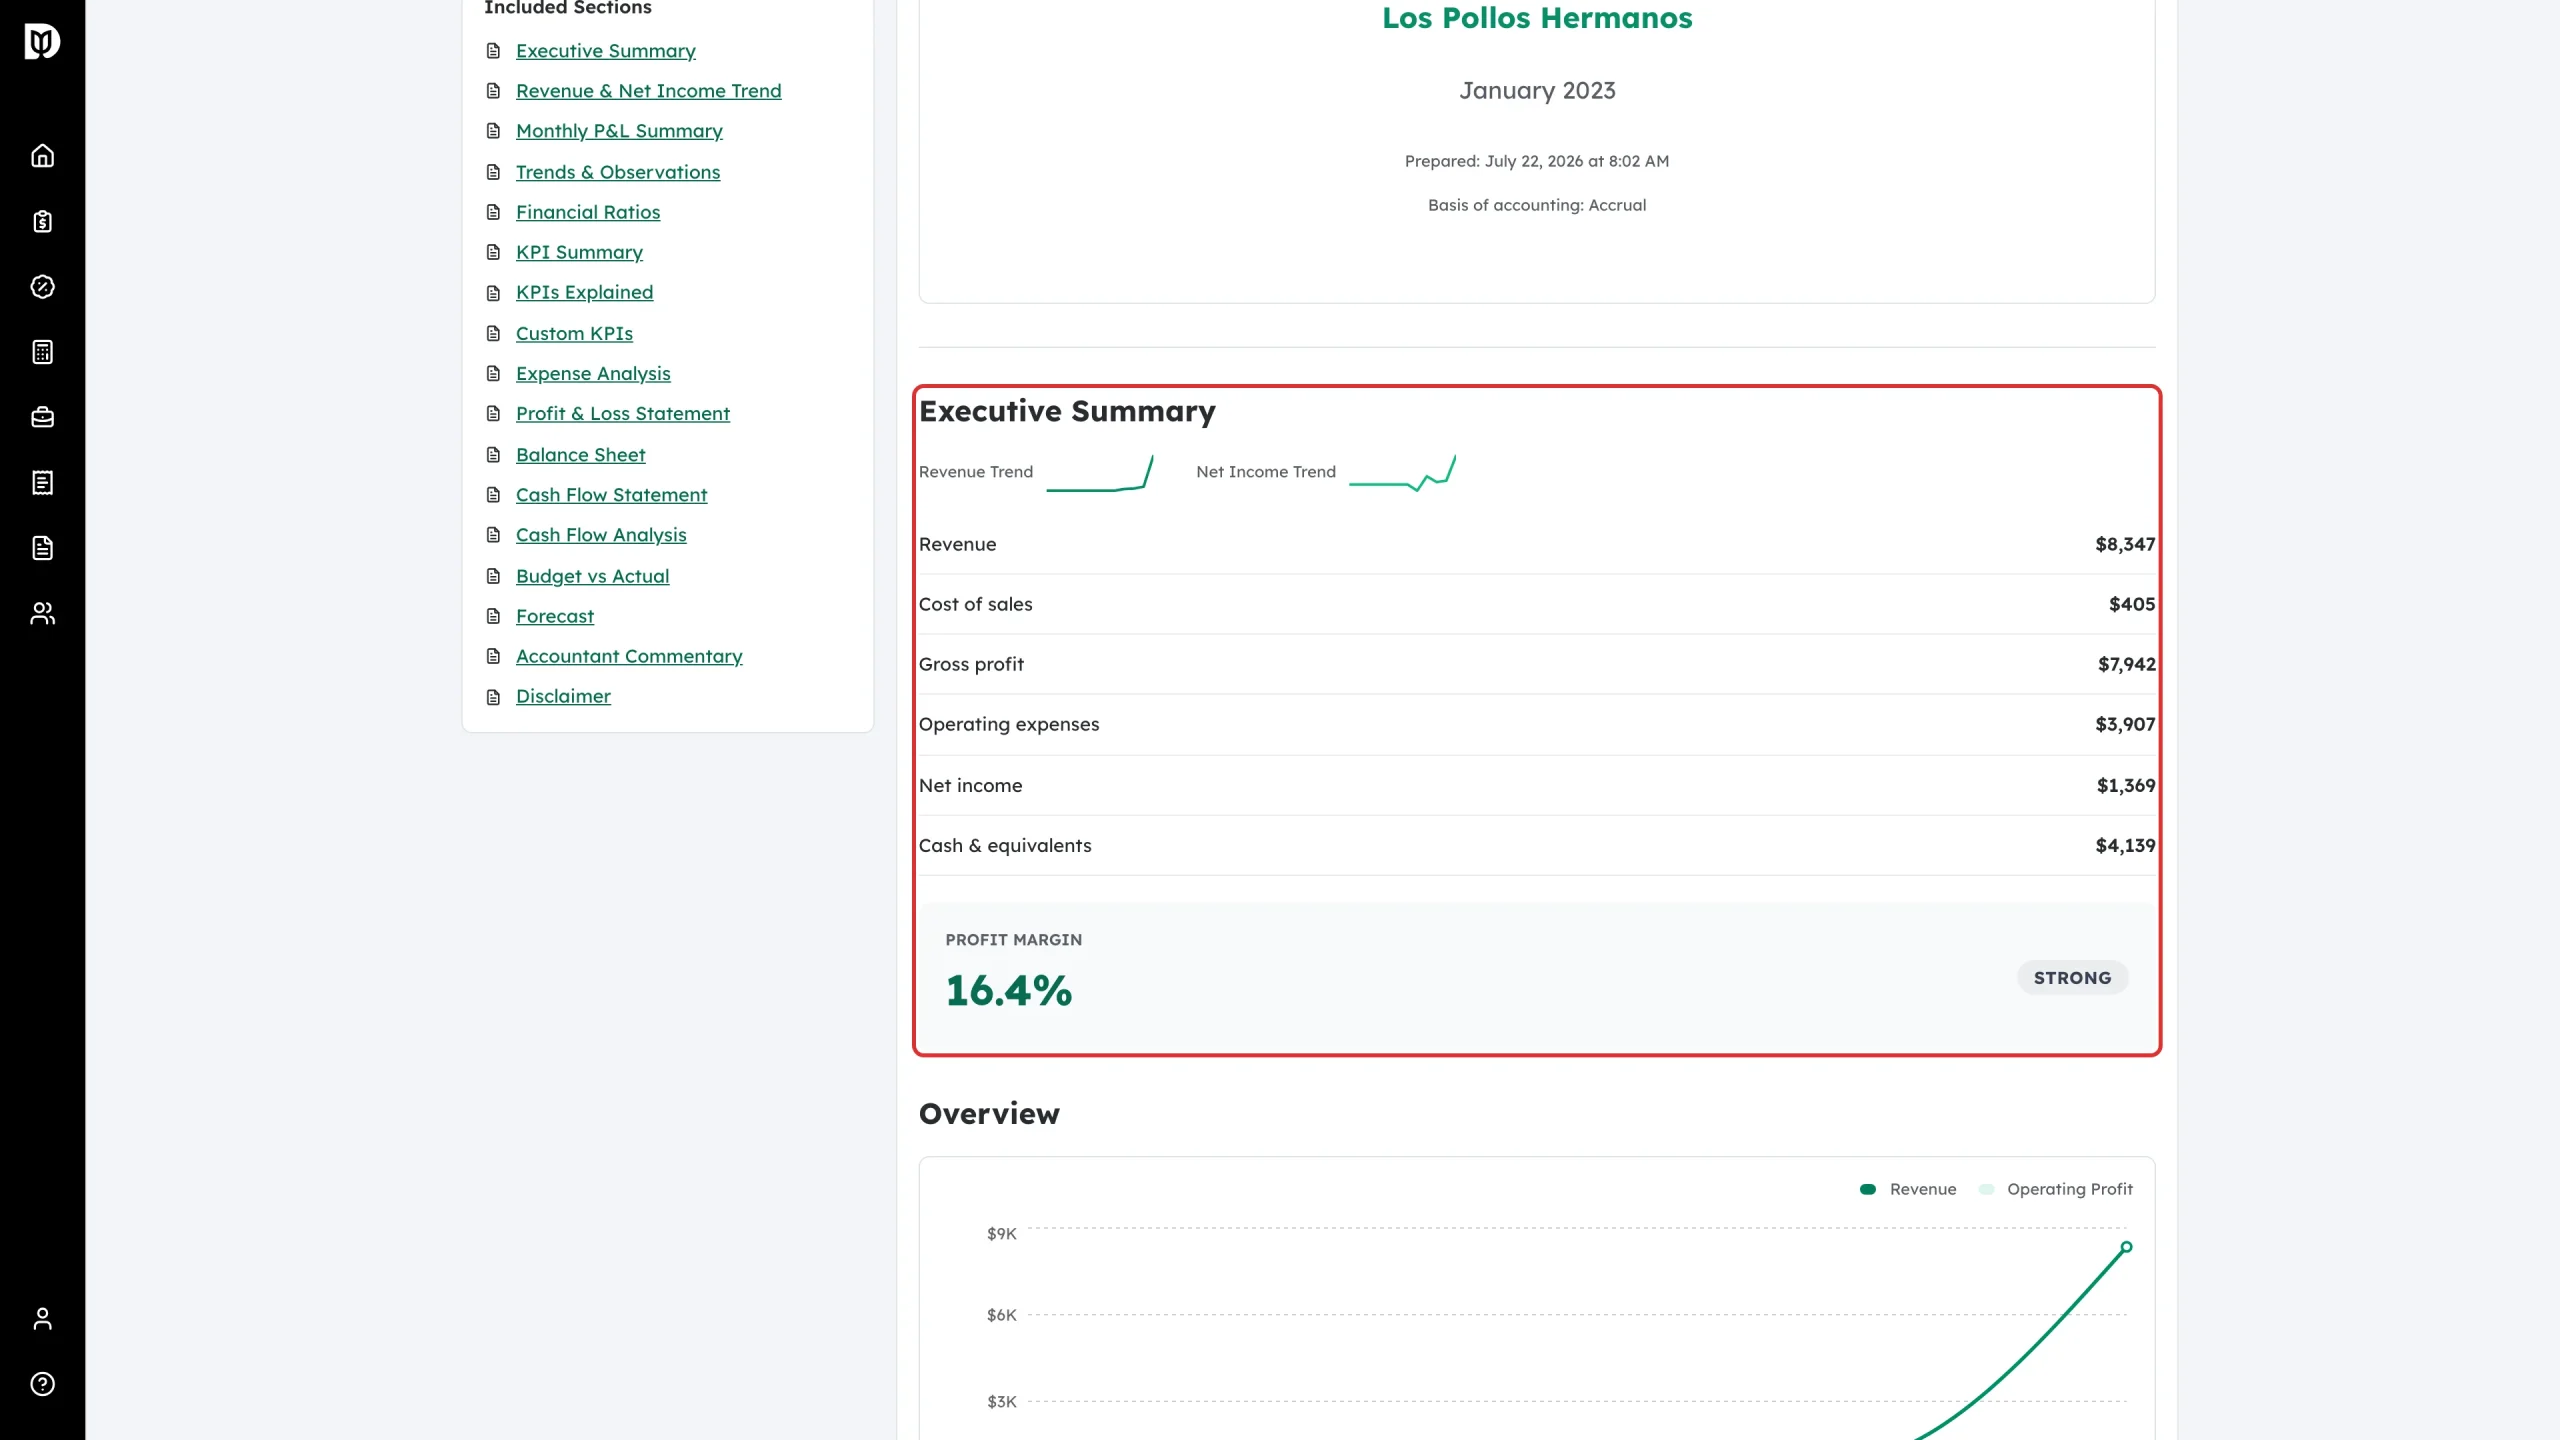
- Executive Summary — revenue, cost of sales, gross profit, operating expenses, net income and cash, with prior-period comparisons and a profit margin rating.
- Revenue & Net Income Trend — a chart of revenue and operating profit over time.
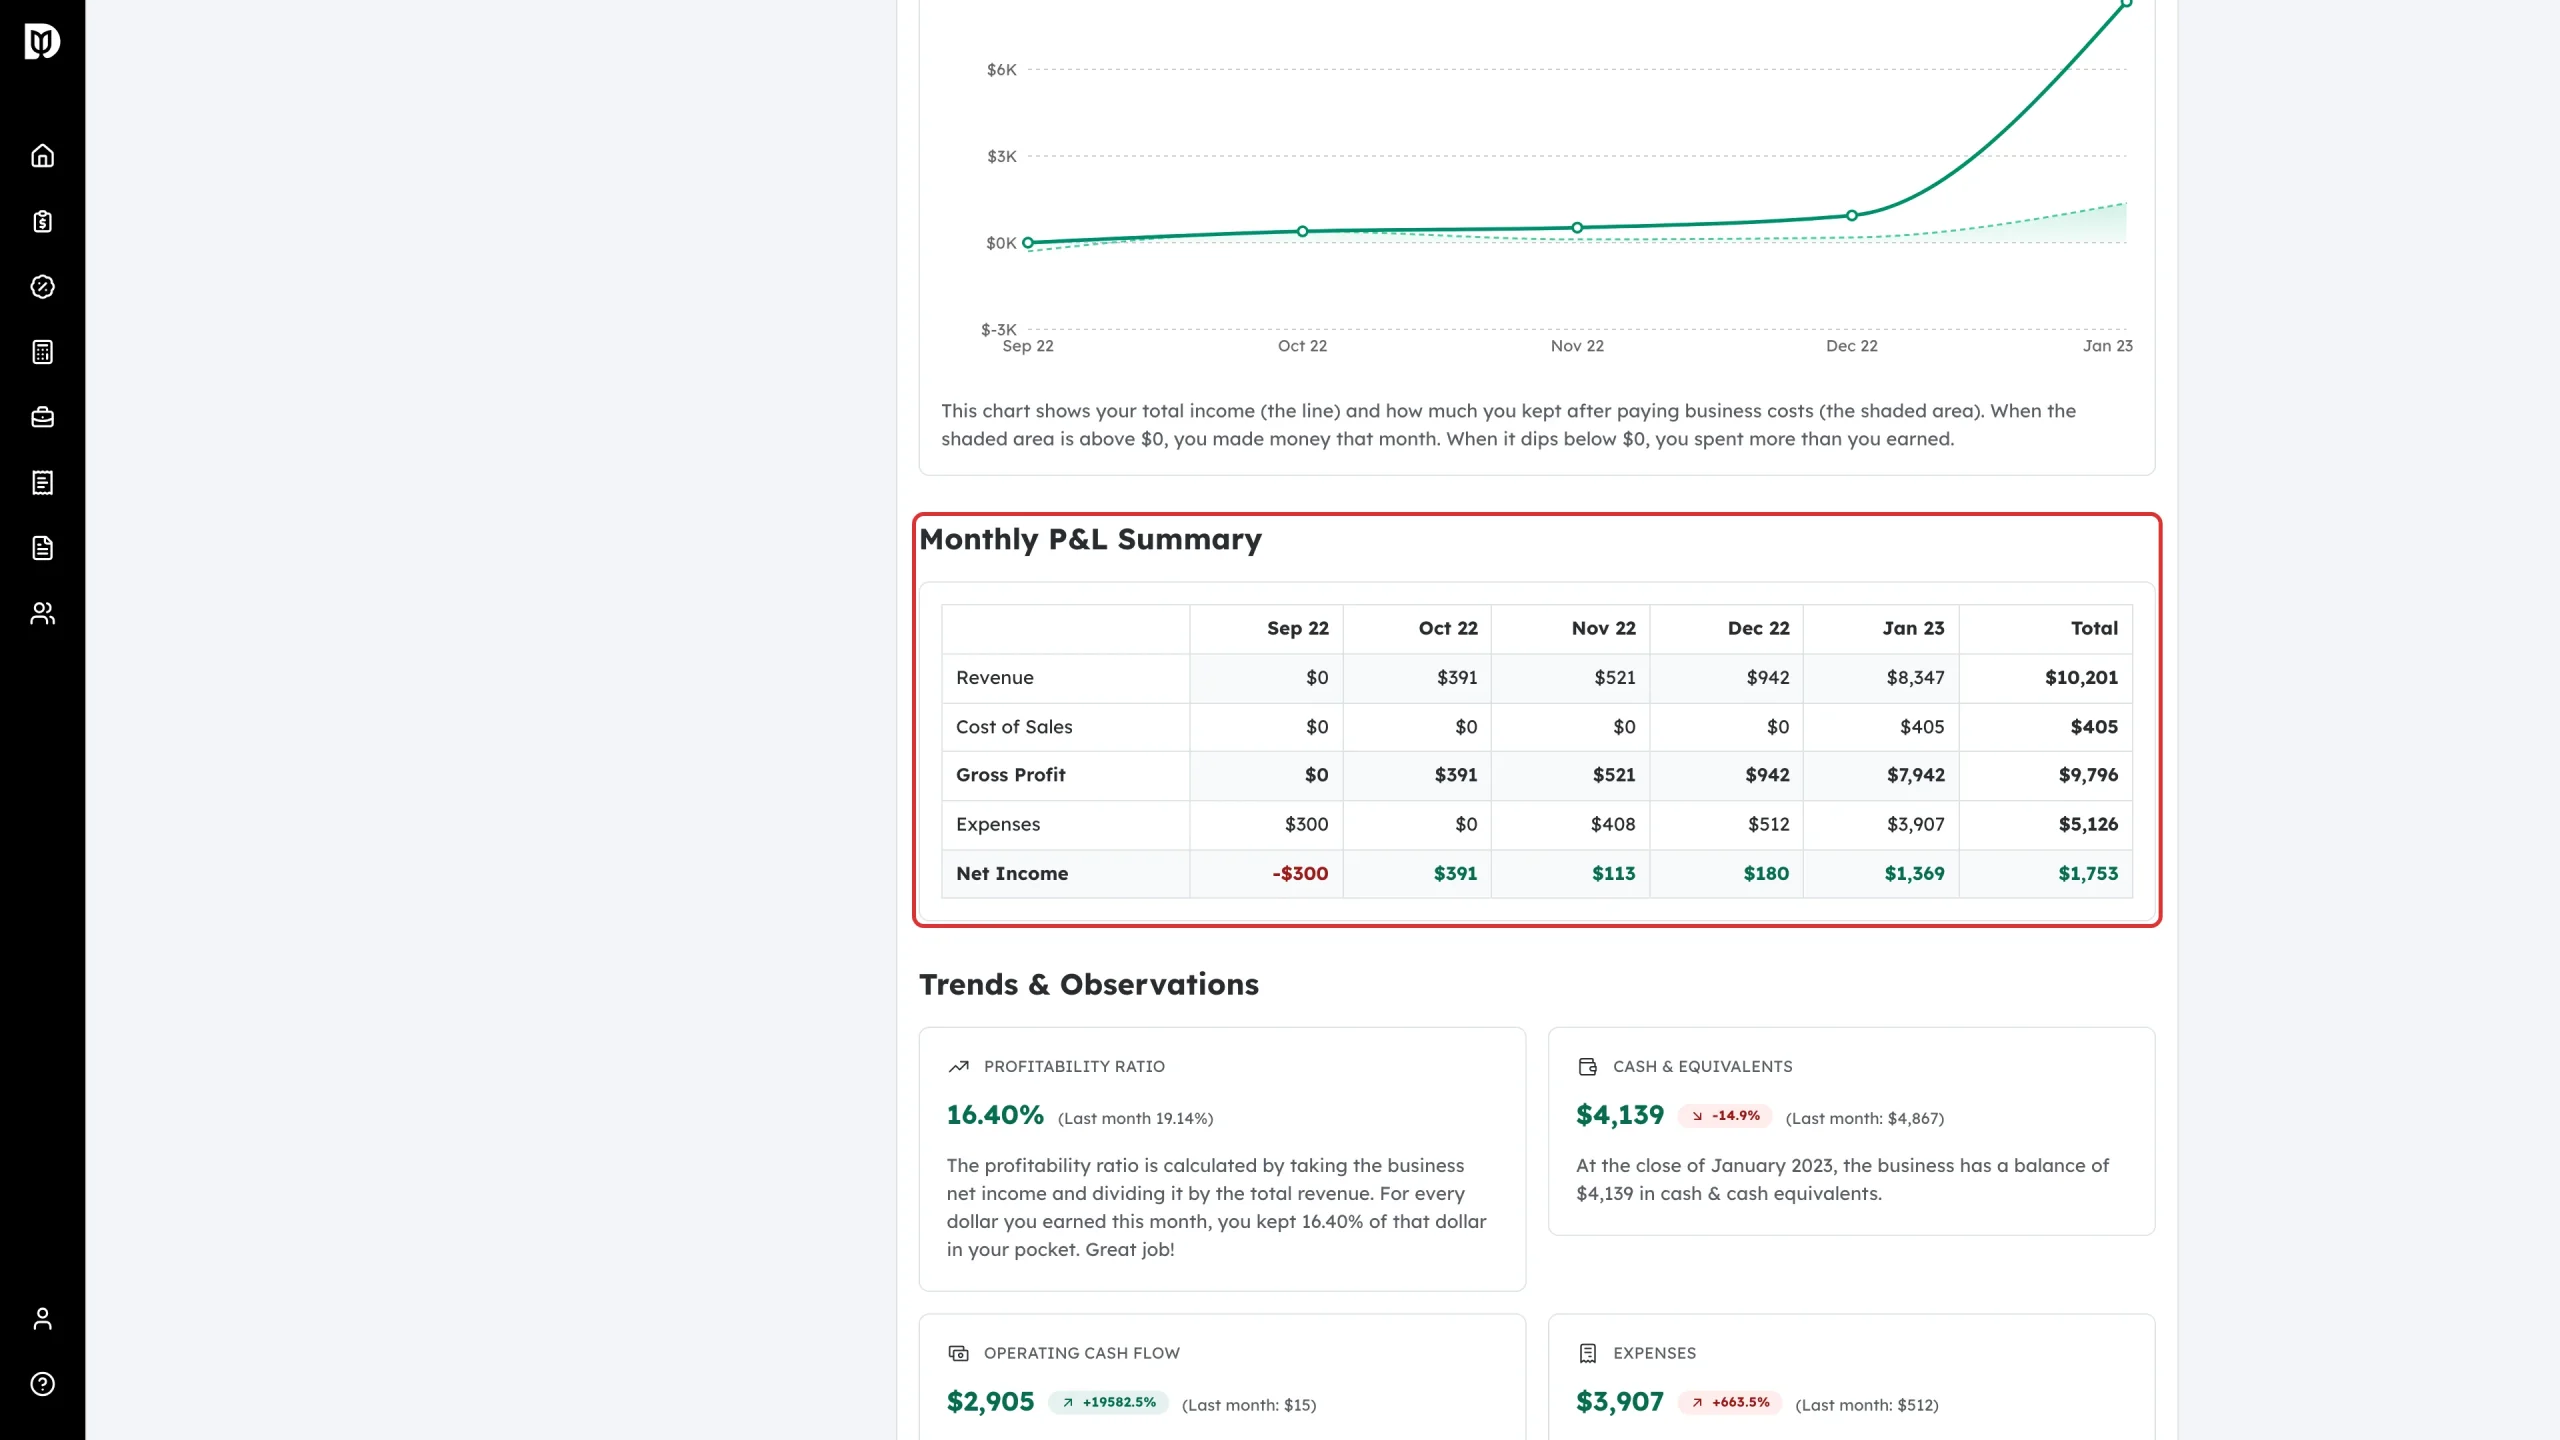
- Monthly P&L Summary — a month-by-month table of revenue, cost of sales, gross profit, expenses and net income.
- Profit & Loss Statement — the full P&L for the last closed month, with every account.
- Profit & Loss — Year to Date — the P&L from the fiscal year start through the report month.
- Profit & Loss by Month — the full fiscal-year P&L with a column for each month.
- Profit & Loss — Year over Year — this year to date against the same period last year, with variance.
- Balance Sheet — assets, liabilities and equity.
- Cash Flow Statement — operating, investing and financing activities.
CFO analysis
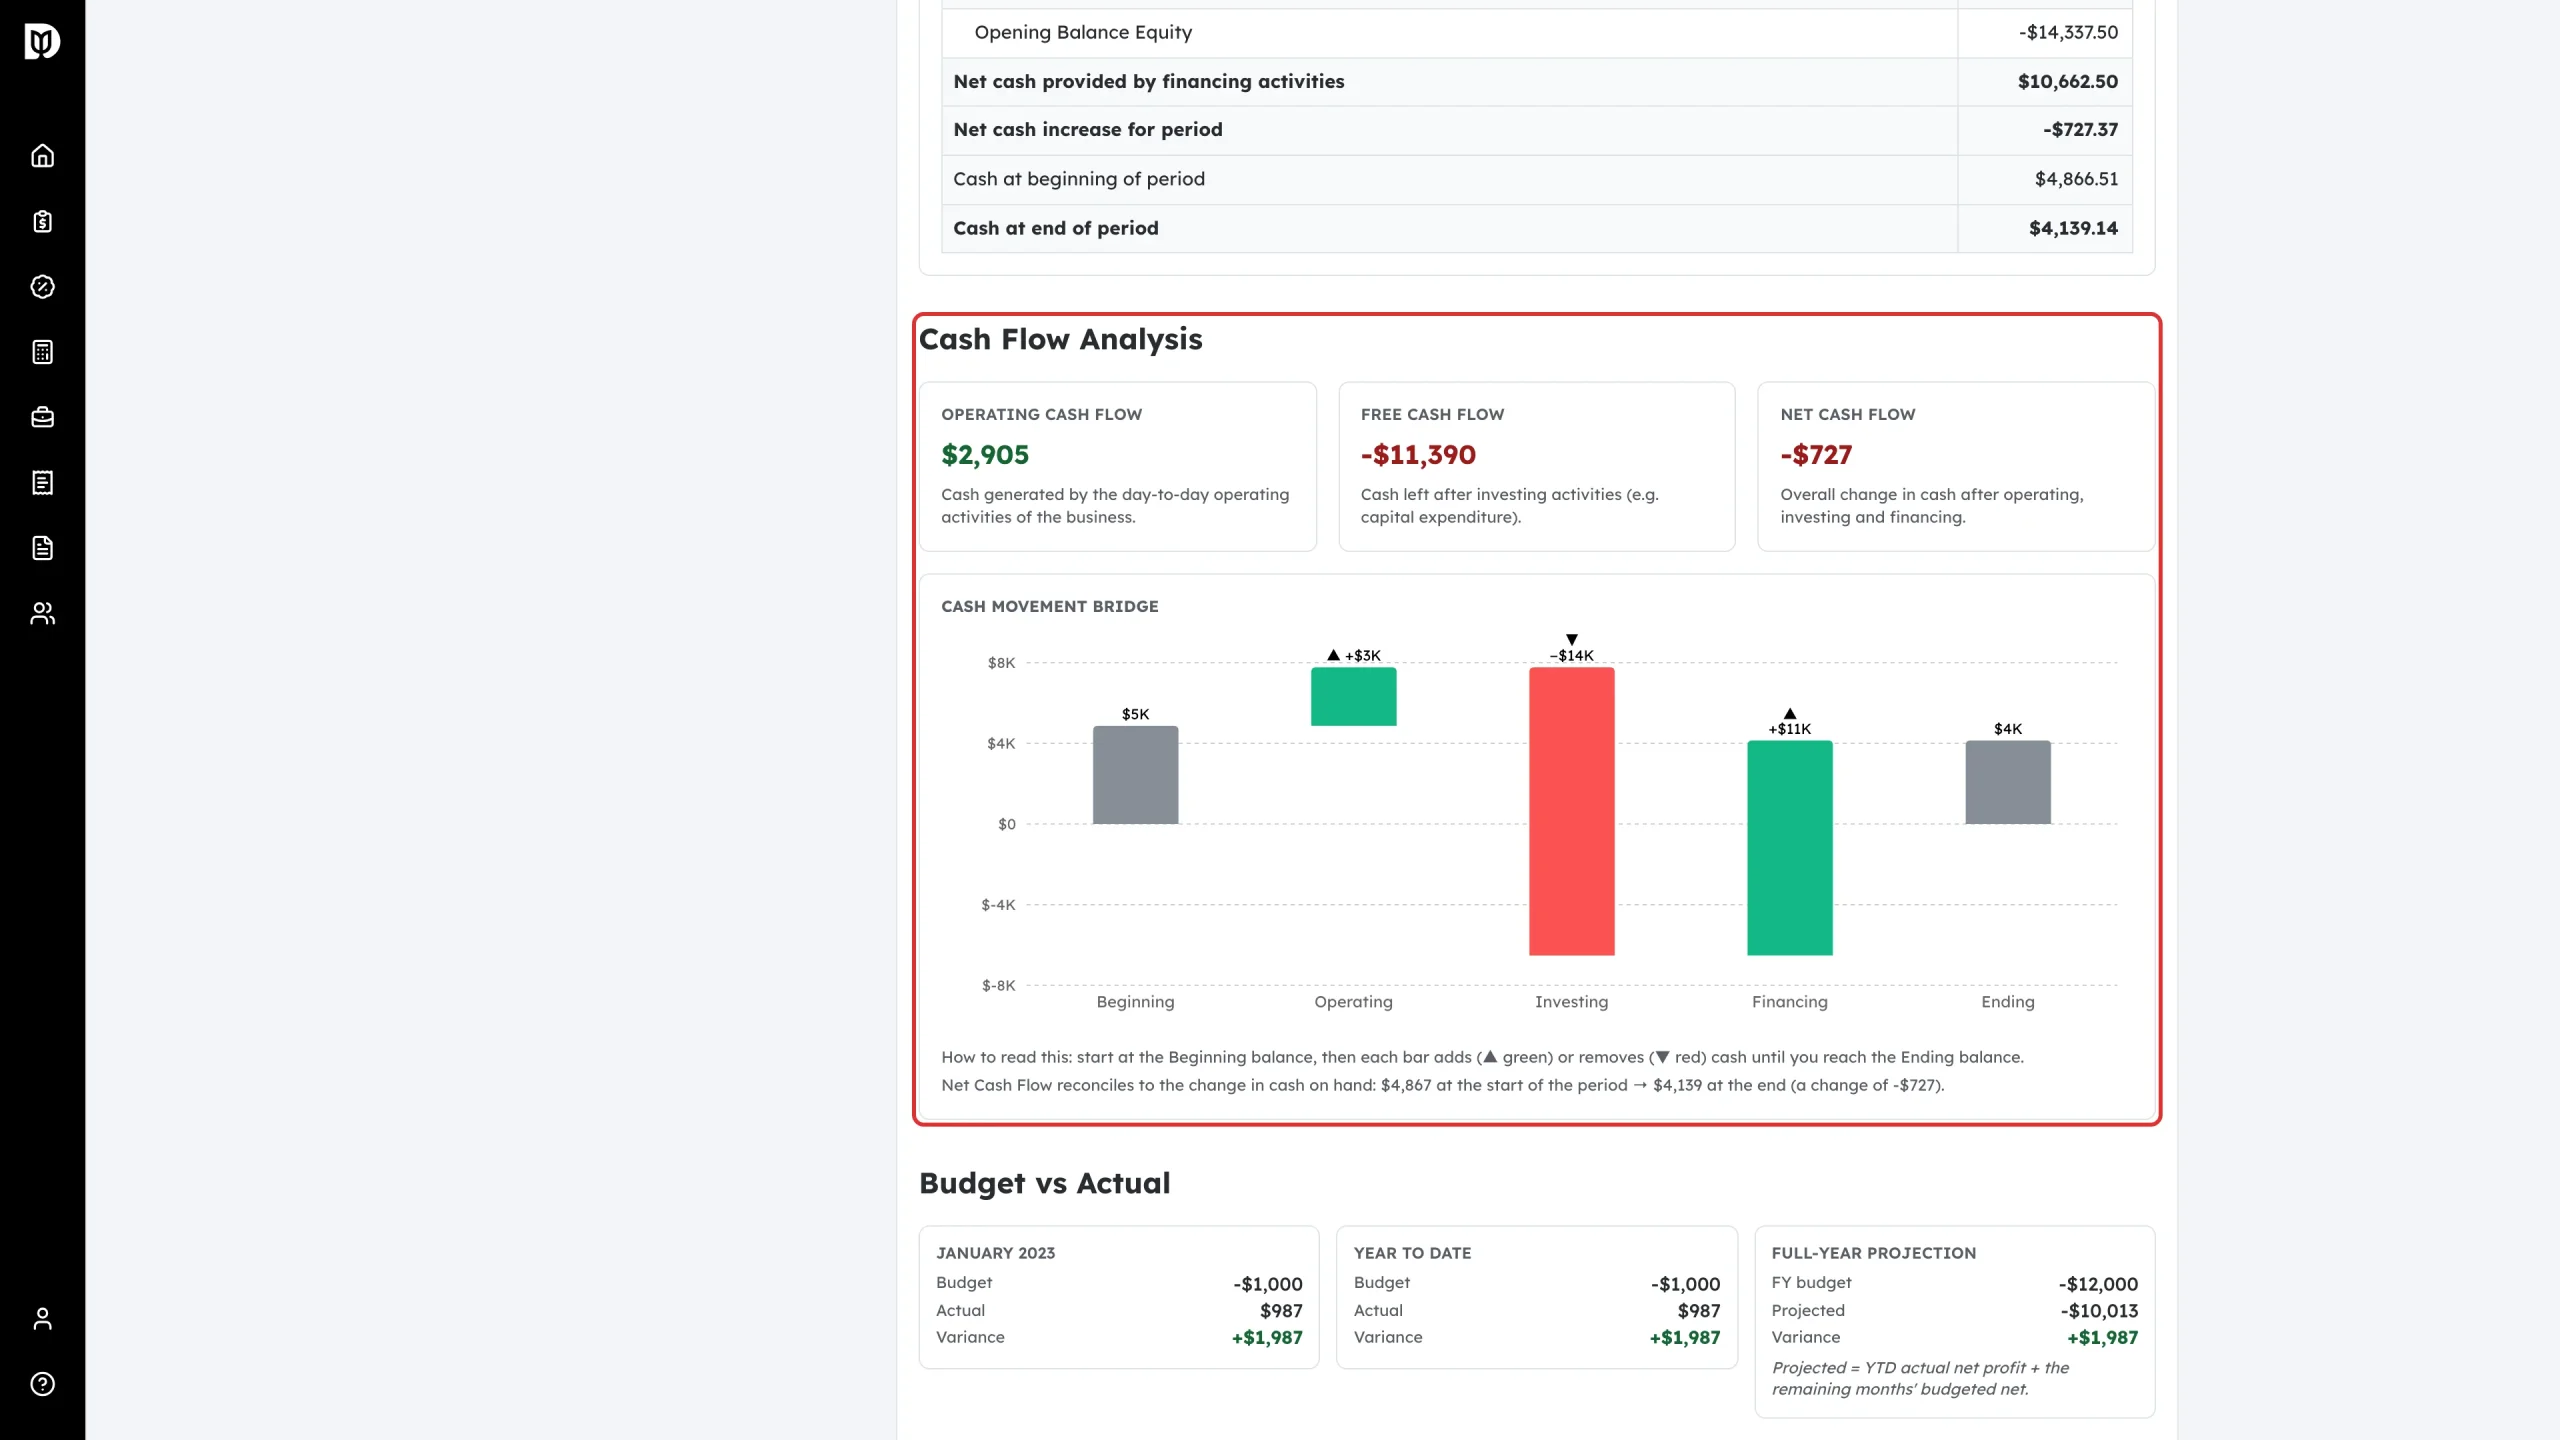
- Cash Flow Analysis — operating, free and net cash flow with a cash-movement bridge and a reconciliation from opening to closing cash.
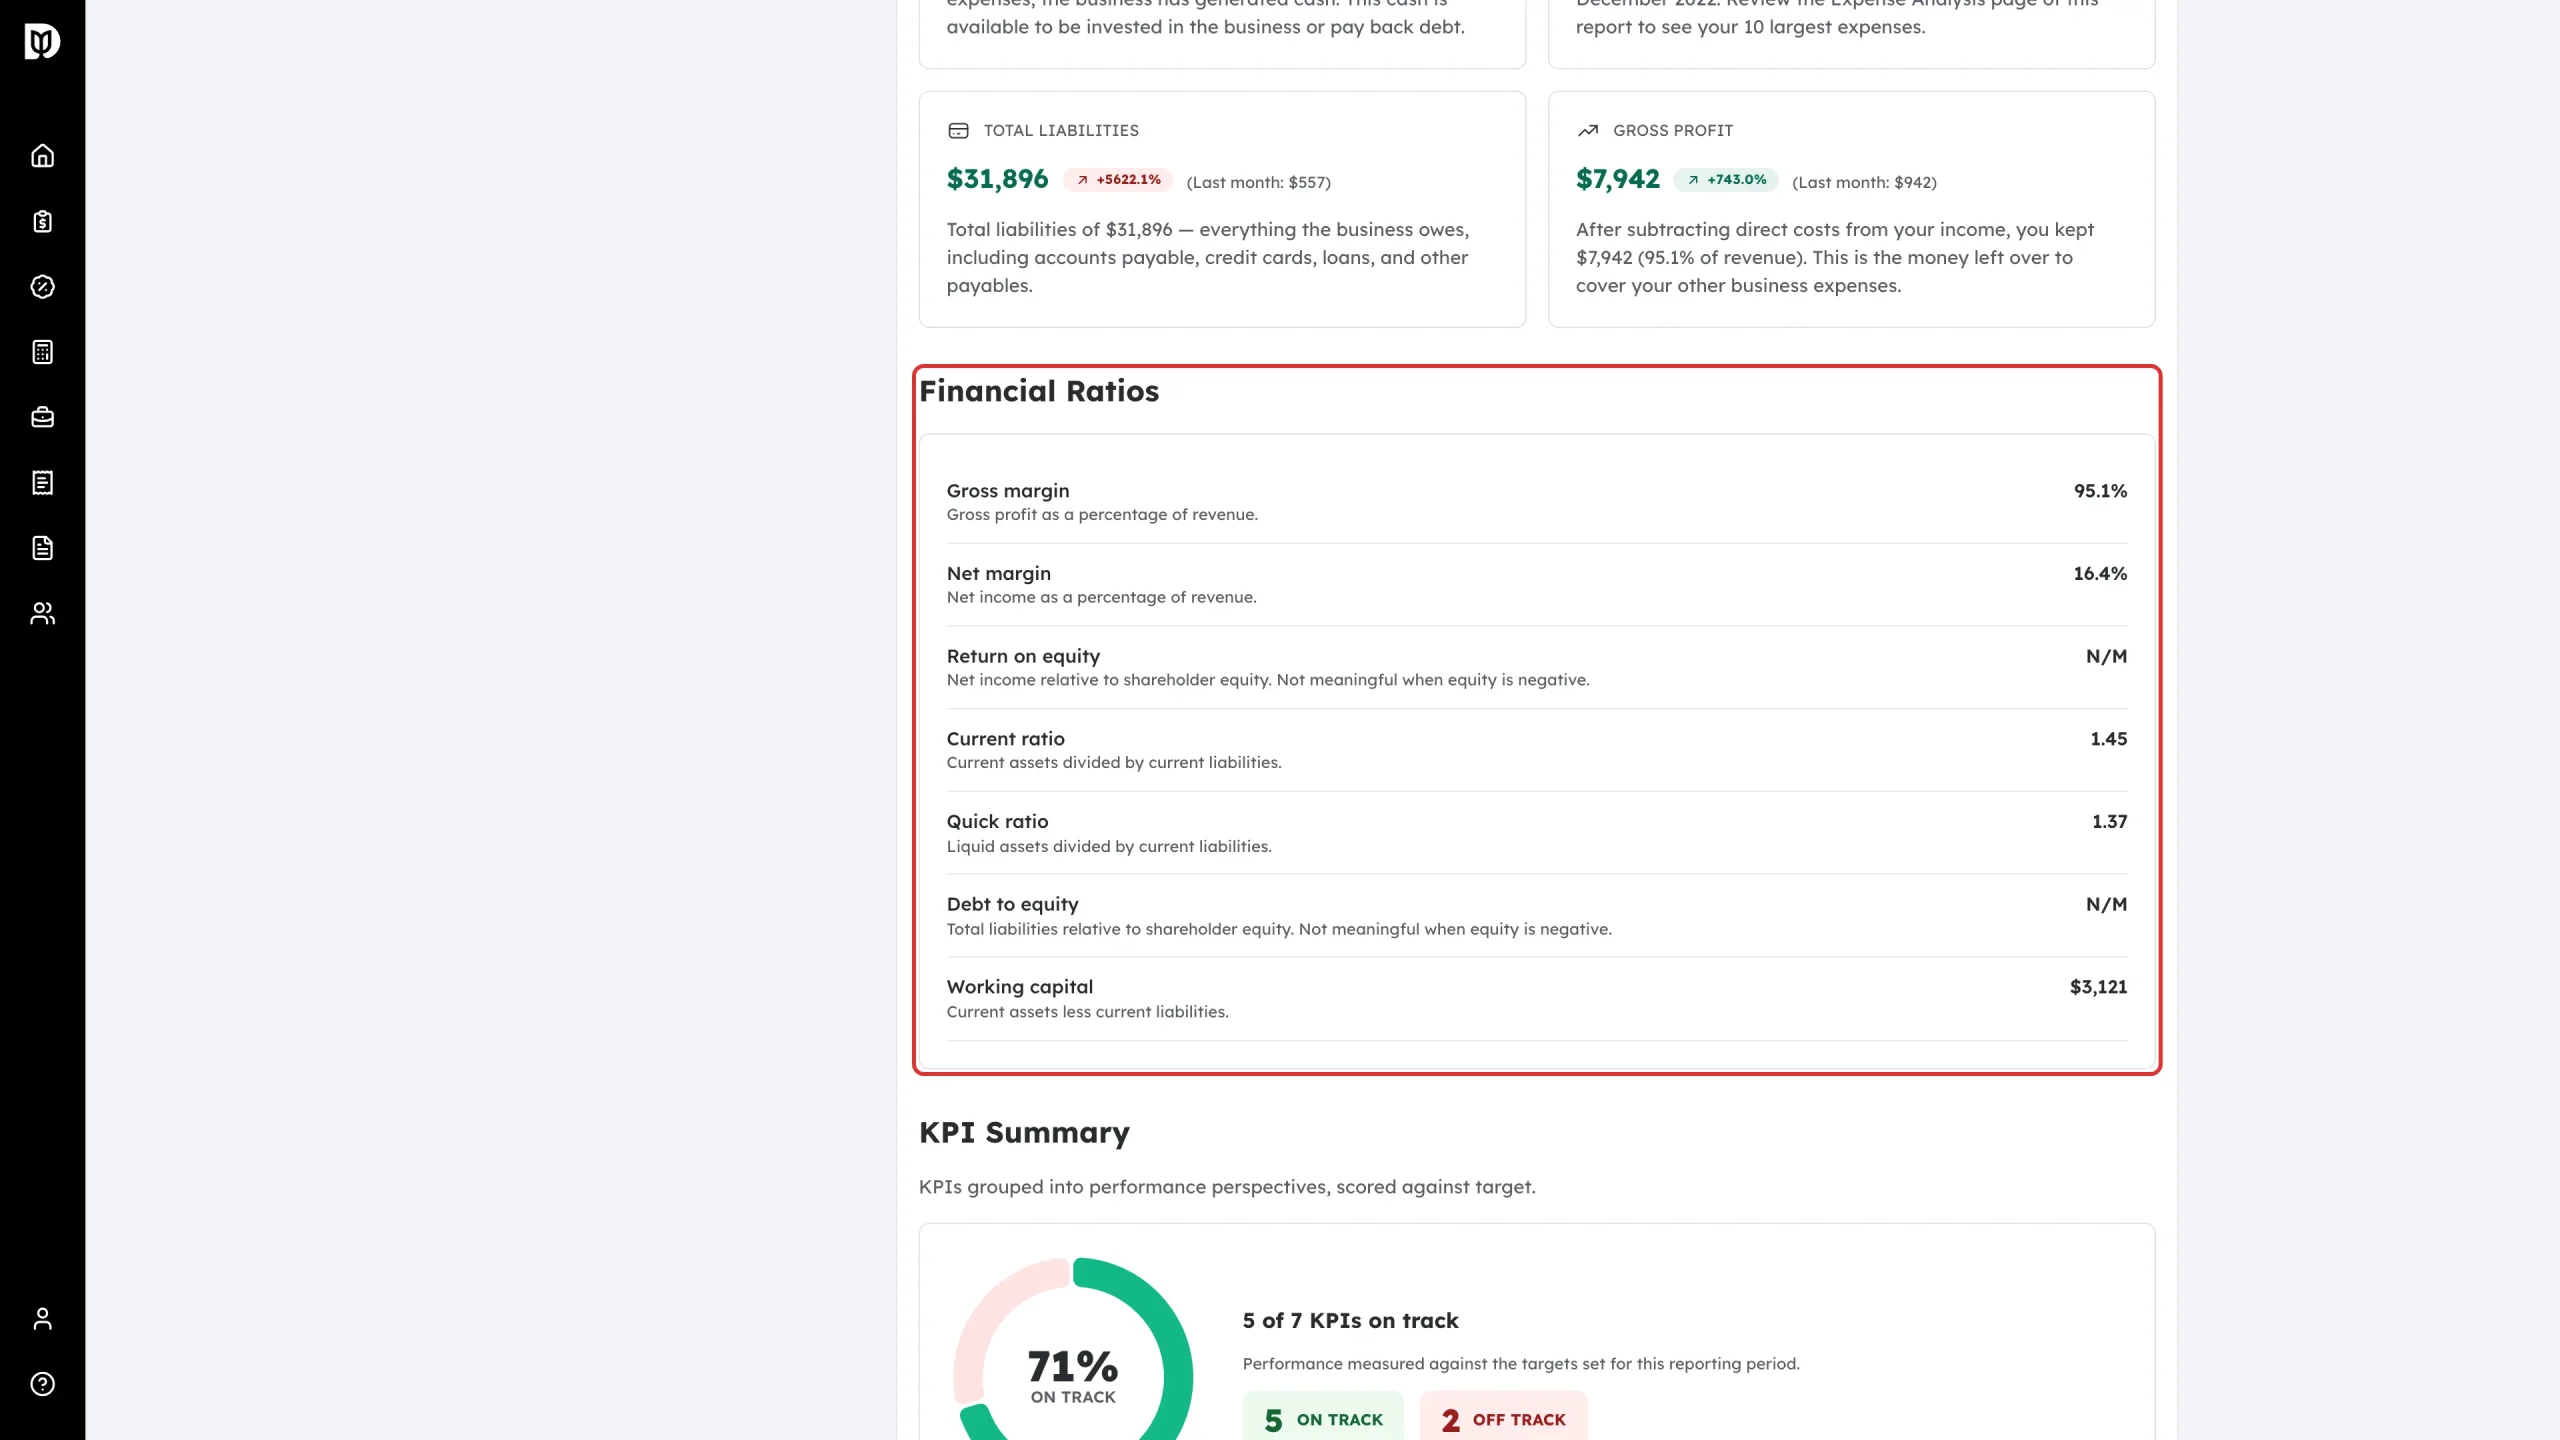
- Financial Ratios — gross and net margin, return on equity, current and quick ratio, debt to equity and working capital.
- KPI Summary — a scorecard of the KPIs you pick, grouped by perspective and scored against their targets.
- KPIs Explained — a plain-English appendix giving each KPI’s value, target, status and formula.
- Custom KPIs — your own KPIs, computed from the report’s own metrics.
- Budget vs Actual — the budget you set on the Budgeting tab against actuals, with variance, a year-to-date roll-up and a full-year projection.
- Expense Analysis — expense breakdown charts and the largest expense categories.
- Trends & Observations — plain-English notes on profitability, cash, operating cash flow, expenses, liabilities and gross profit.
- Forecast — a base, best and worst case projection of the Forecasting scenario you pick, shown exactly as it is on the Forecasting view, with a line saying what it starts from.
Narrative and closing
- Accountant Commentary — your narrative for the client, shown on the cover.
- Narrative / Text — free-form text you can place anywhere in the report.
- Disclaimer — the basis-of-preparation and limitations statement, which you can edit. Write “cash/accrual basis” and the report fills in its own basis of accounting.
What happens next
Once you know which sections you want, add them in Edit Report Sections, or save the report as a template so you can reuse the same set for other clients.
Troubleshooting
- A ratio shows “N/M”. It isn’t meaningful for the period — for example, return on equity when equity is negative.
- Budget vs Actual is empty. No budget has been saved for that company and fiscal year yet.
- Forecast is empty. No forecast scenario has been built for the company on the Forecasting tab.