Who this is for: Reviewers and senior bookkeepers checking period-over-period movements before signing off a close.
What you’ll learn: How to compare this month to the prior month on the profit and loss and balance sheet, and how to draft, edit, and save commentary on the variances.
Before you begin
- Open the client’s Month End tab and select the Flux Analysis tab.
- Flux Analysis reads live reports from QuickBooks, so the client must be connected and both months must have activity.
Step-by-step instructions
-
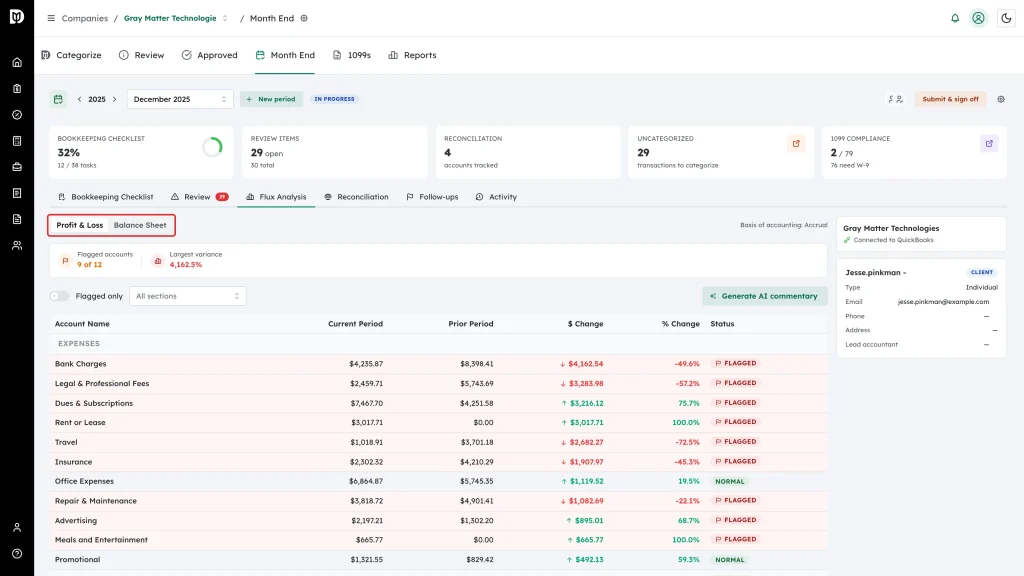
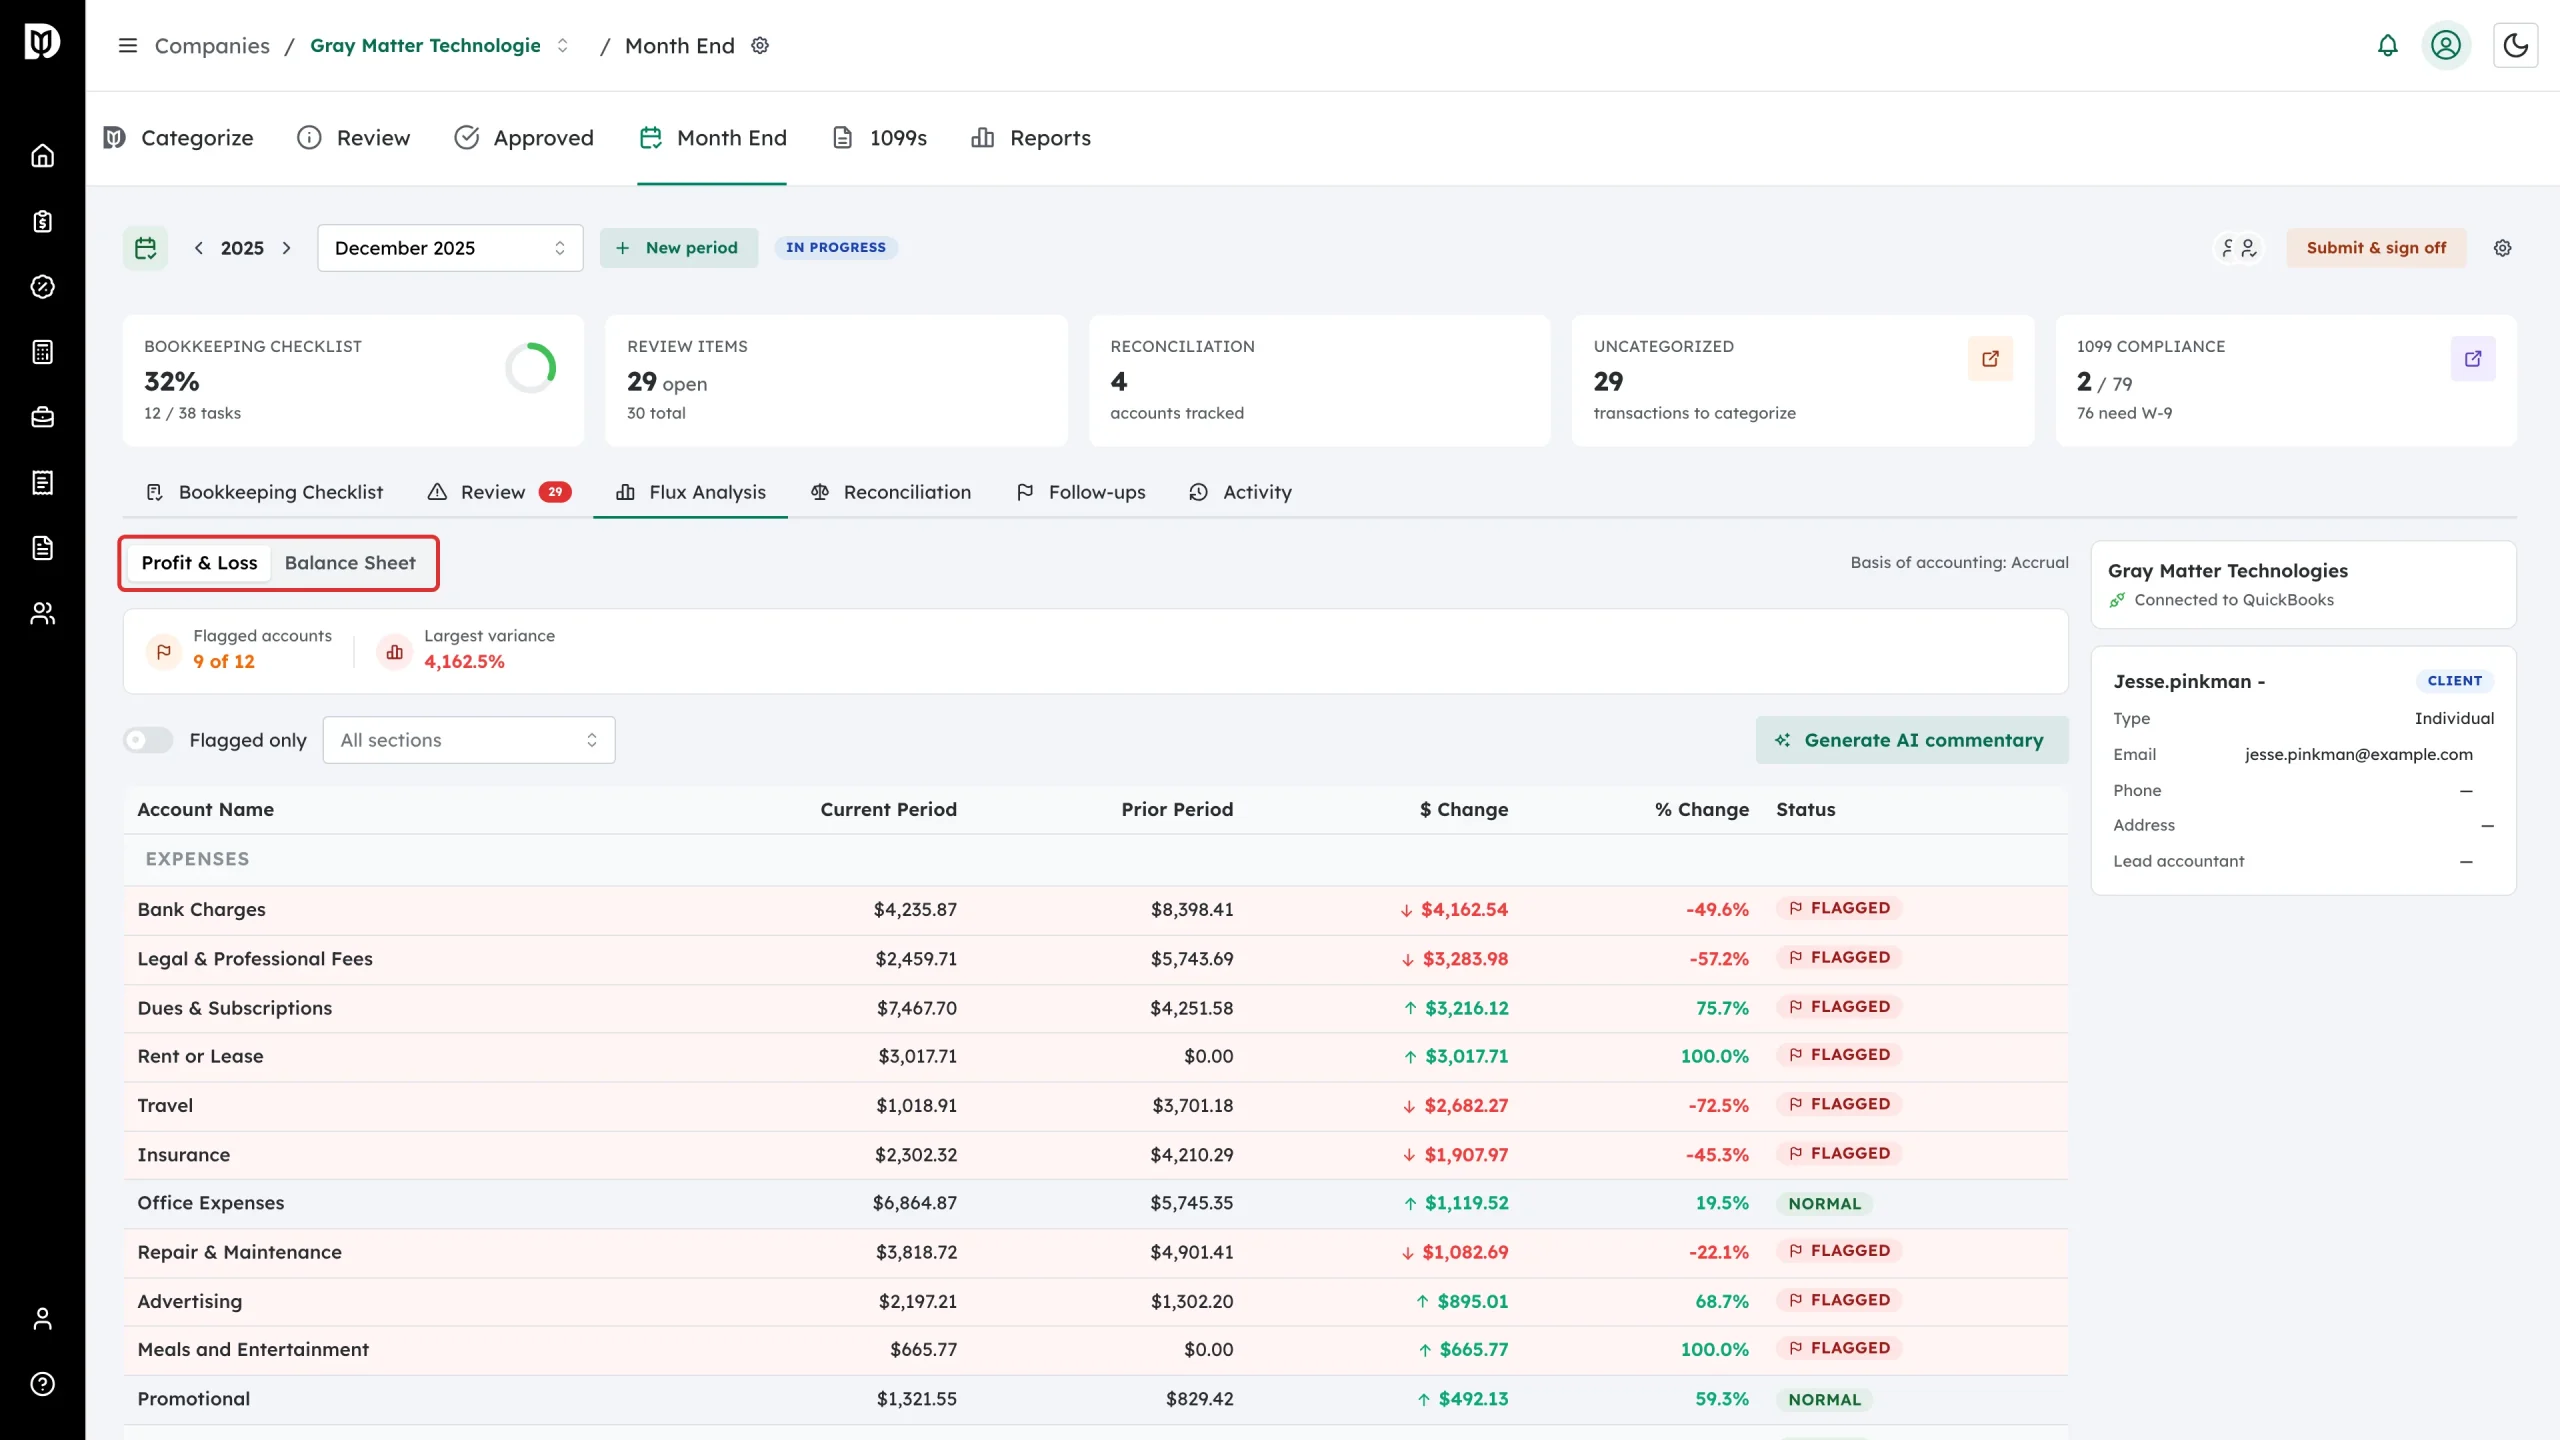
Switch between Profit & Loss and Balance Sheet. The basis both periods were pulled on — Accrual or Cash — is shown on the right.
-
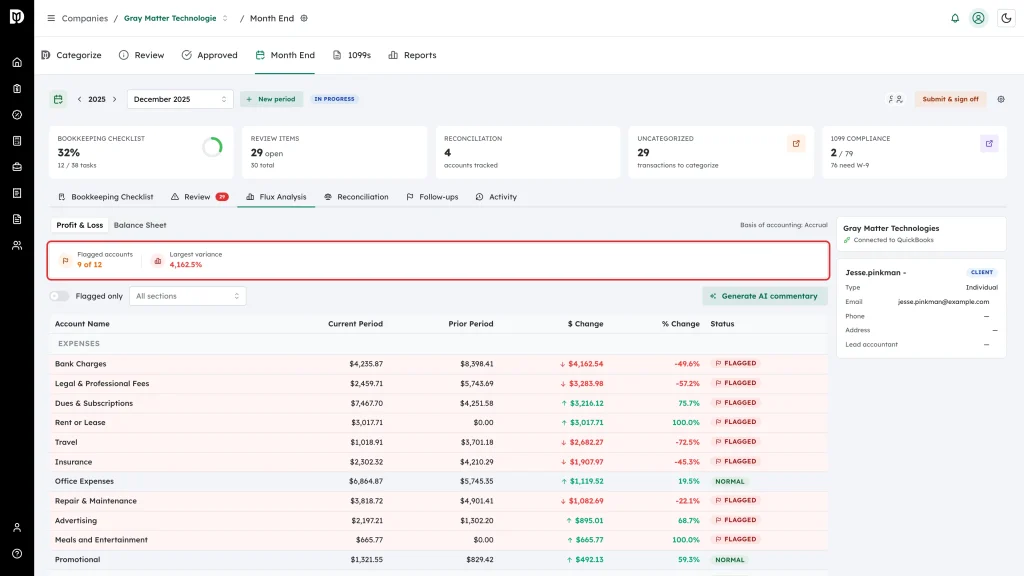
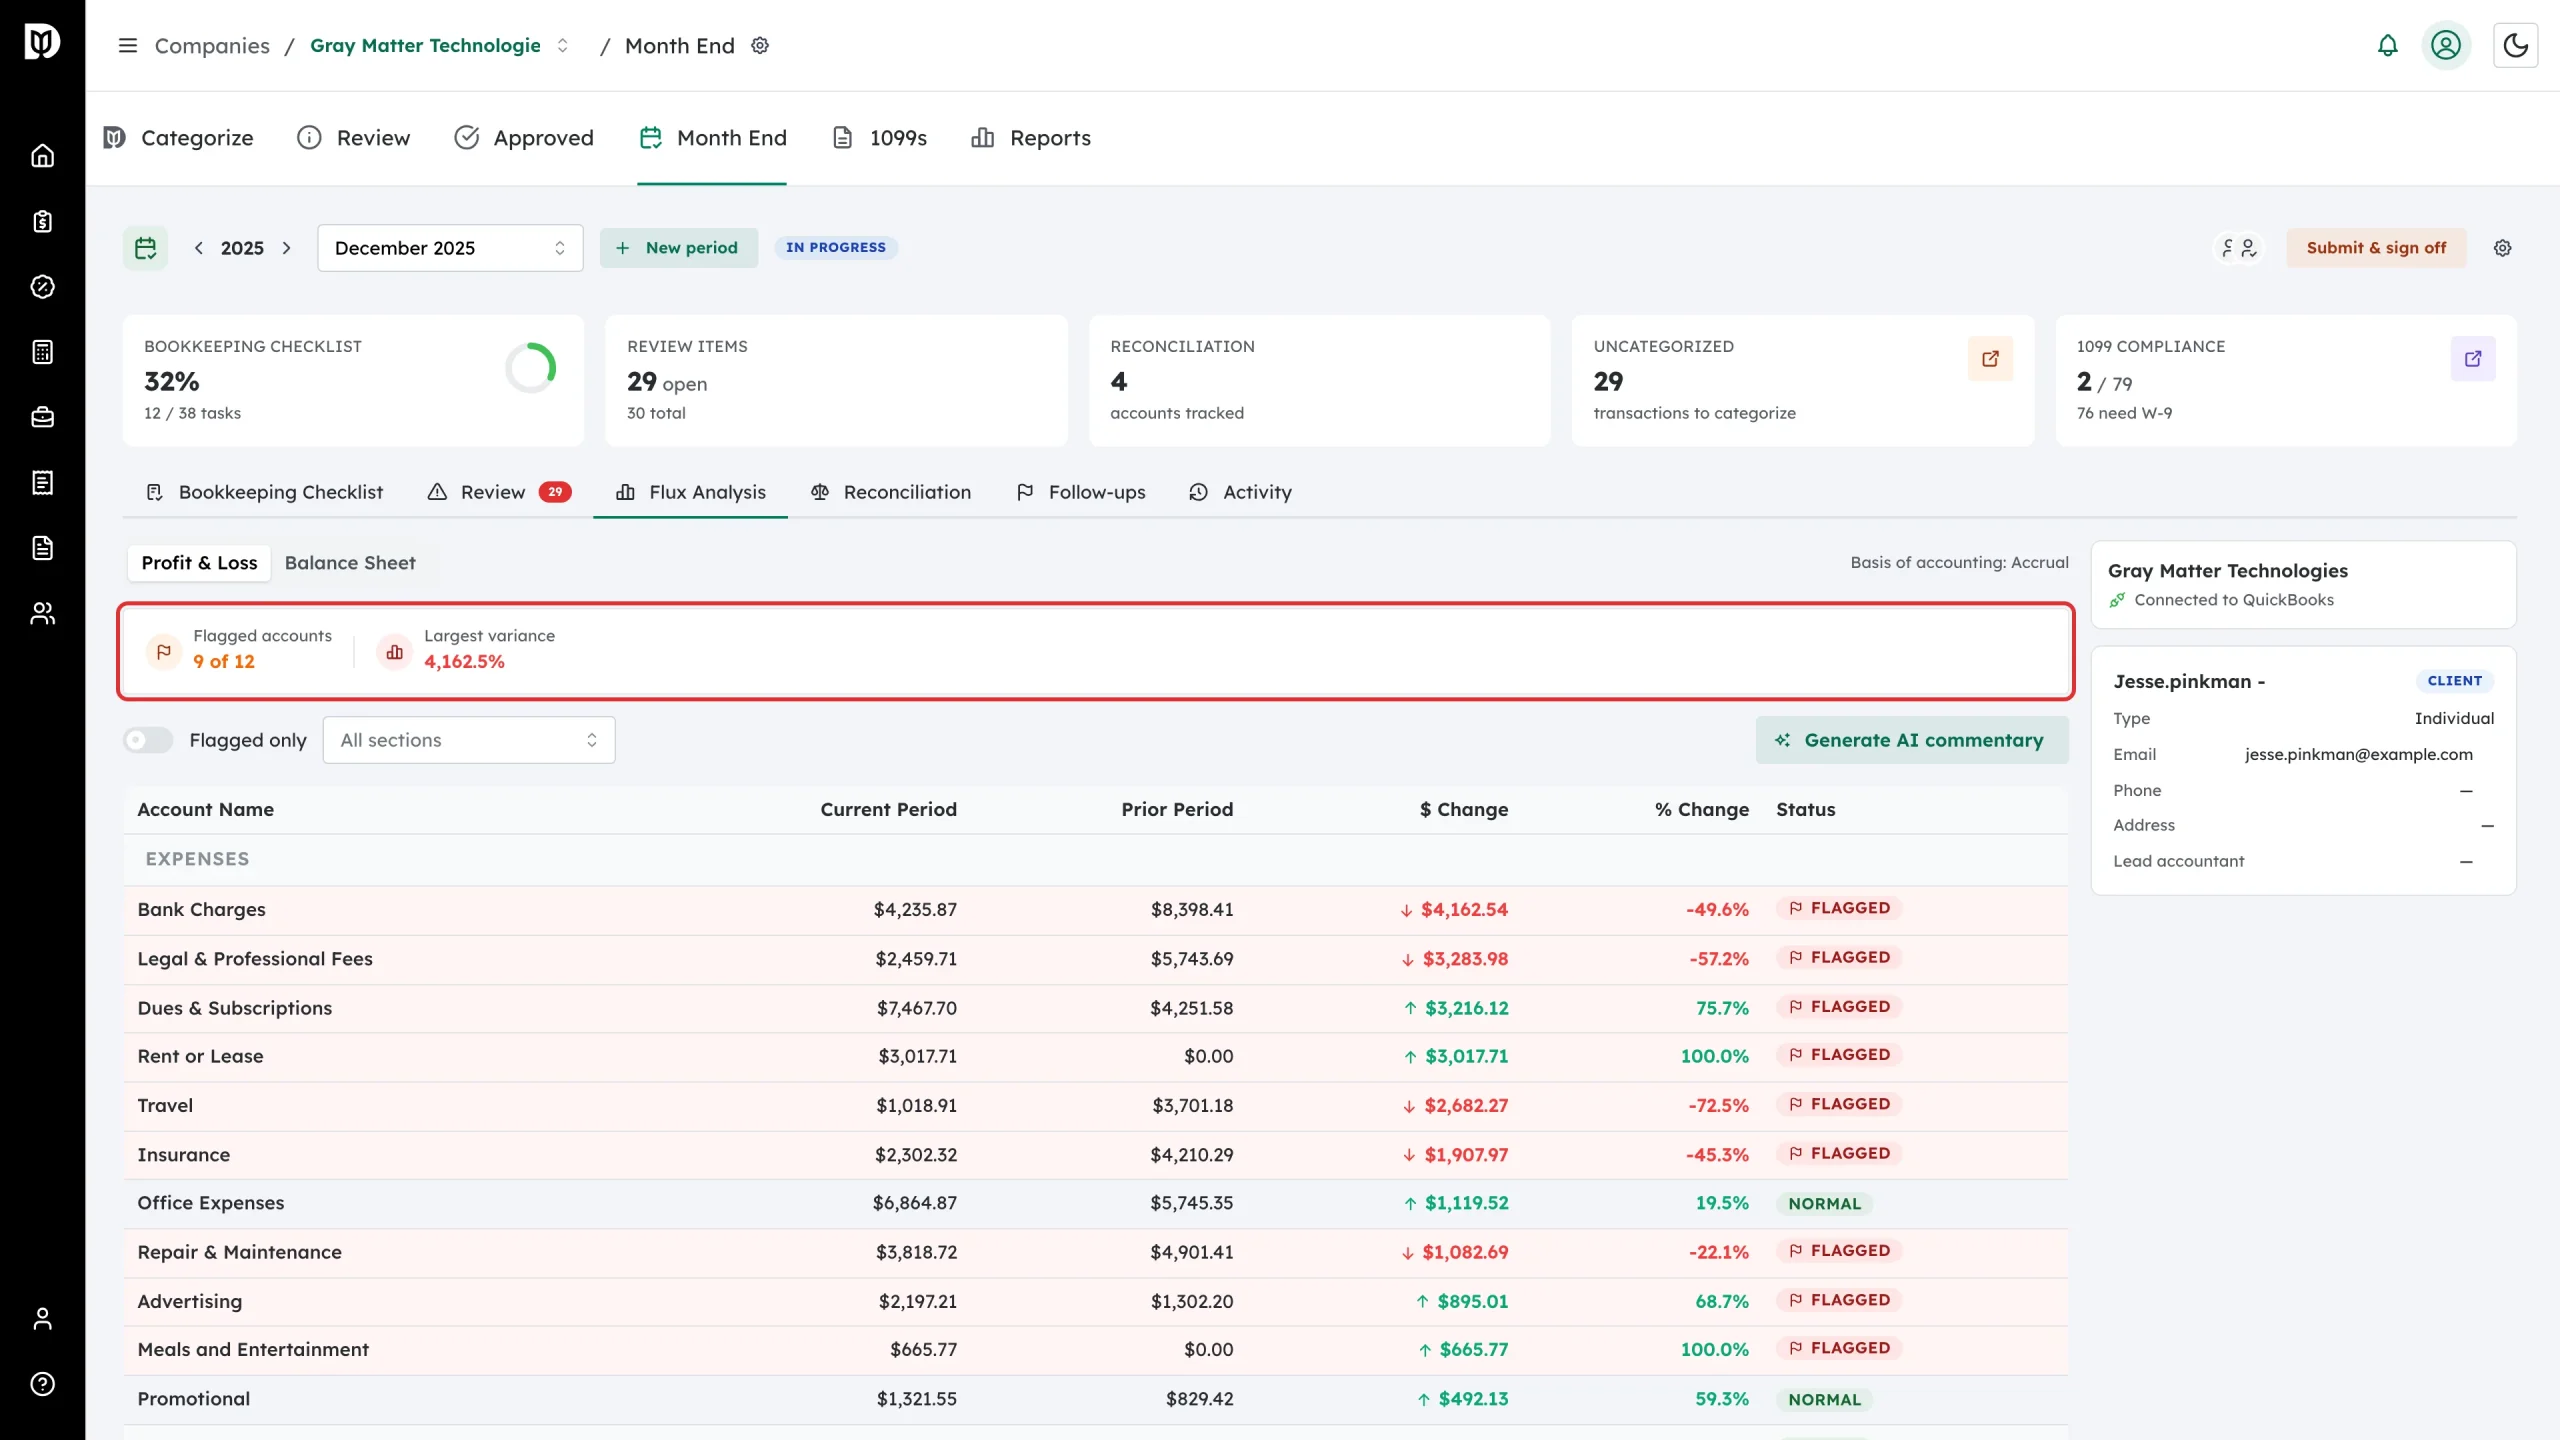
Read the summary strip: how many accounts were flagged out of the total, and the largest movement. An account is flagged when it moves by at least 20% and at least $500 against the prior month.
-
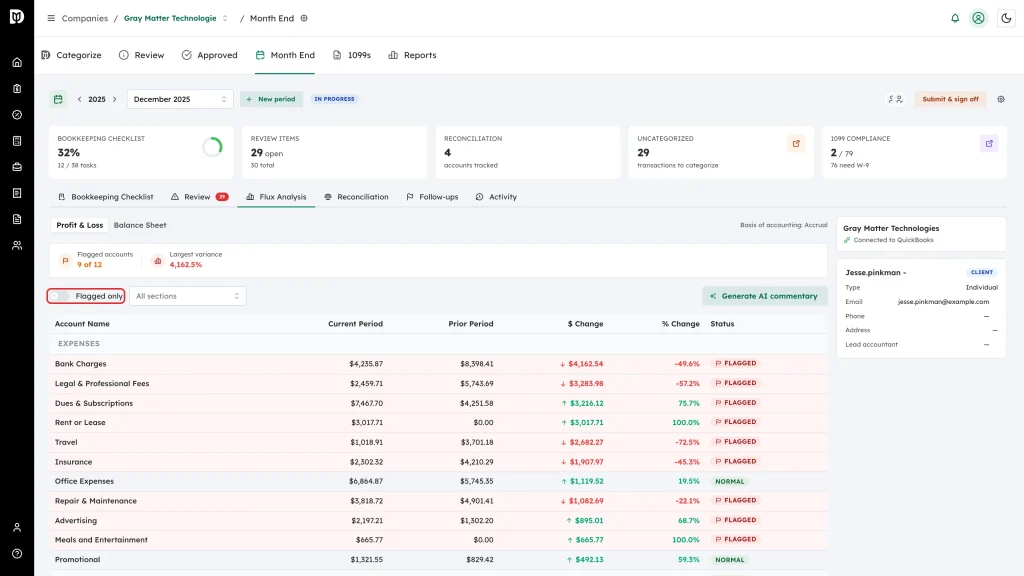
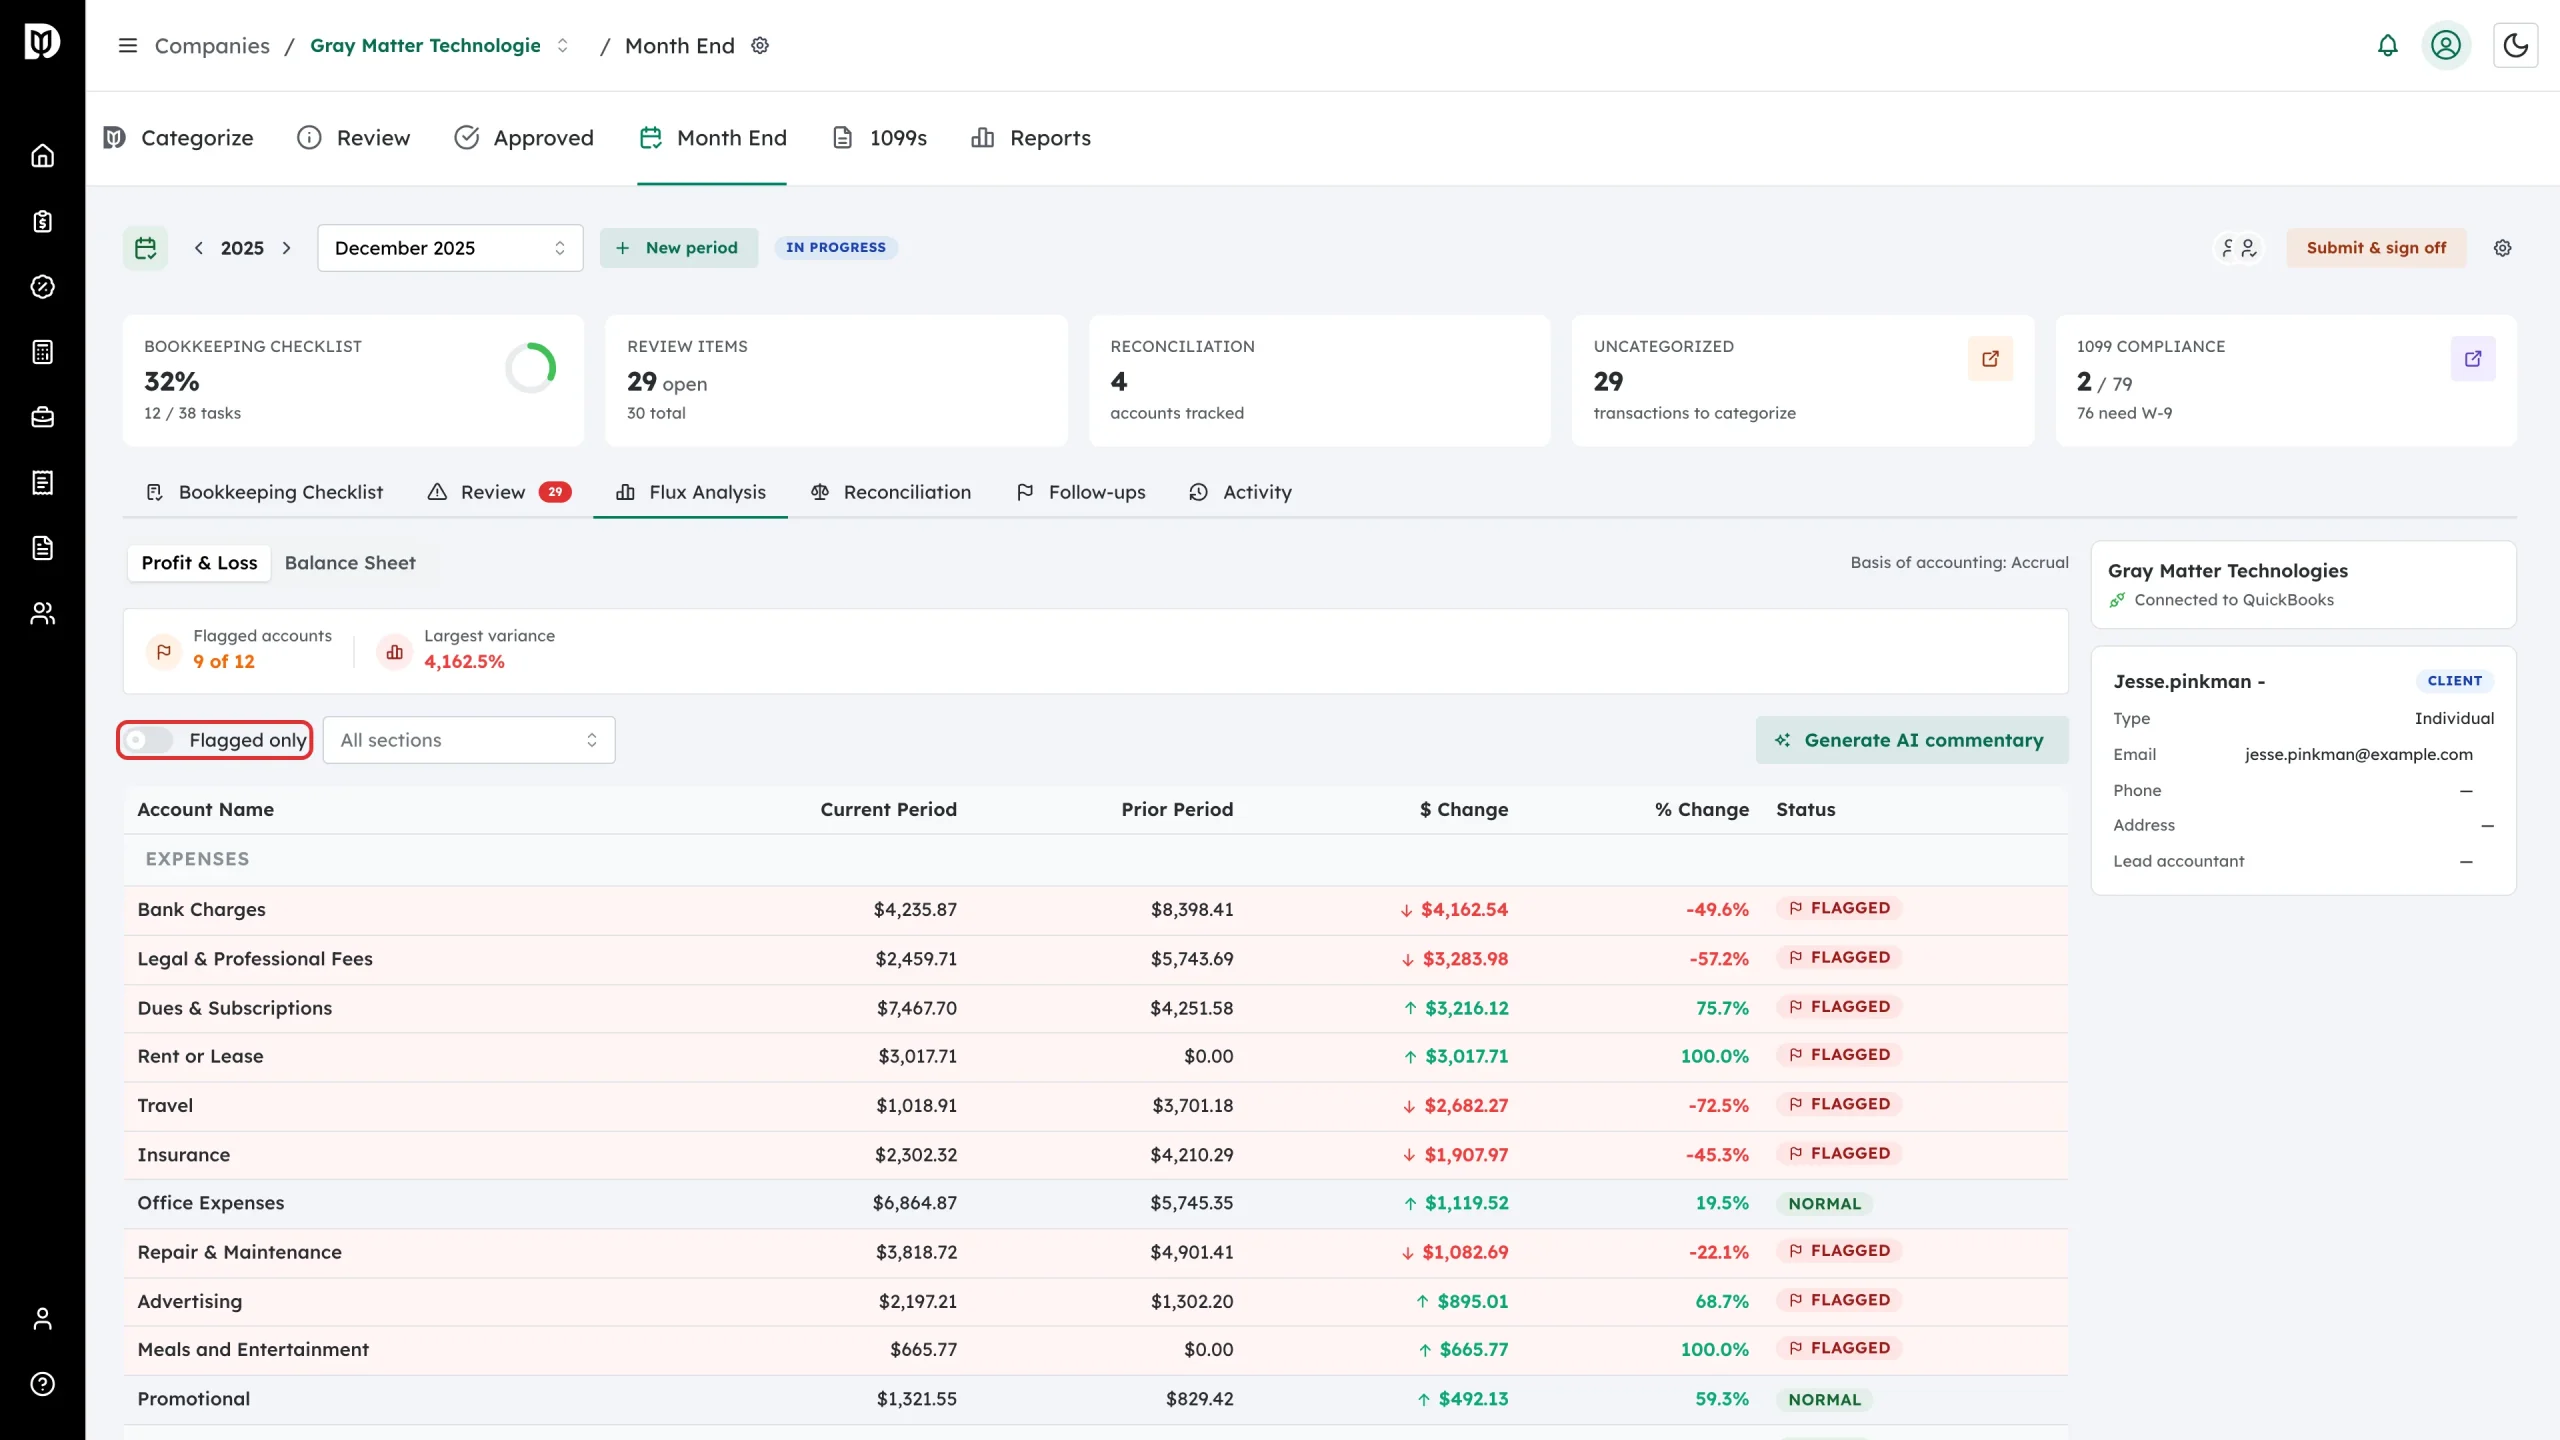
Turn on Flagged only to hide everything that moved normally, or use the section dropdown to look at one part of the report — Income, Cost of Goods Sold, Expenses, Other Income, Other Expenses on the P&L; Assets, Liabilities, Equity on the balance sheet.
-
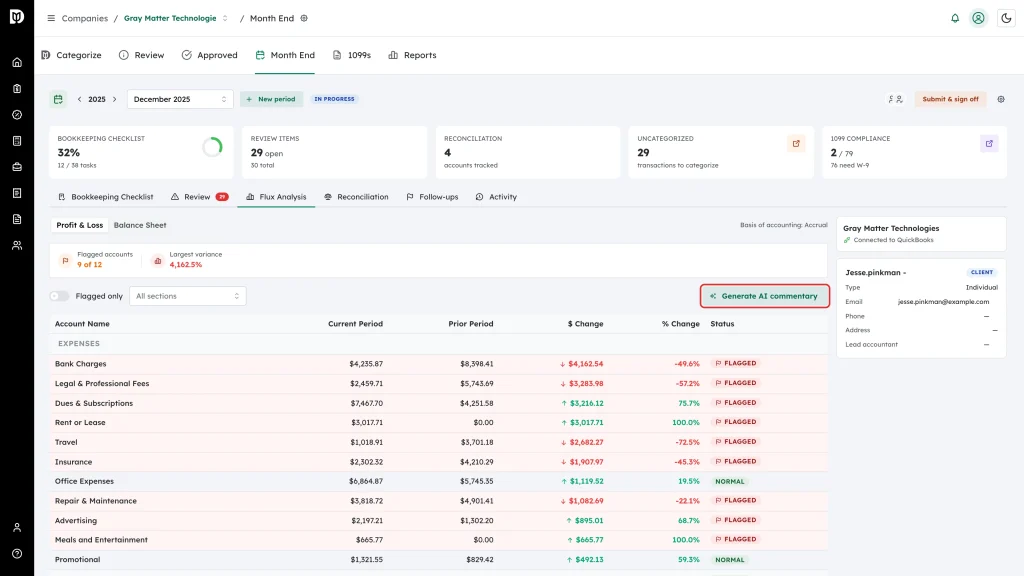
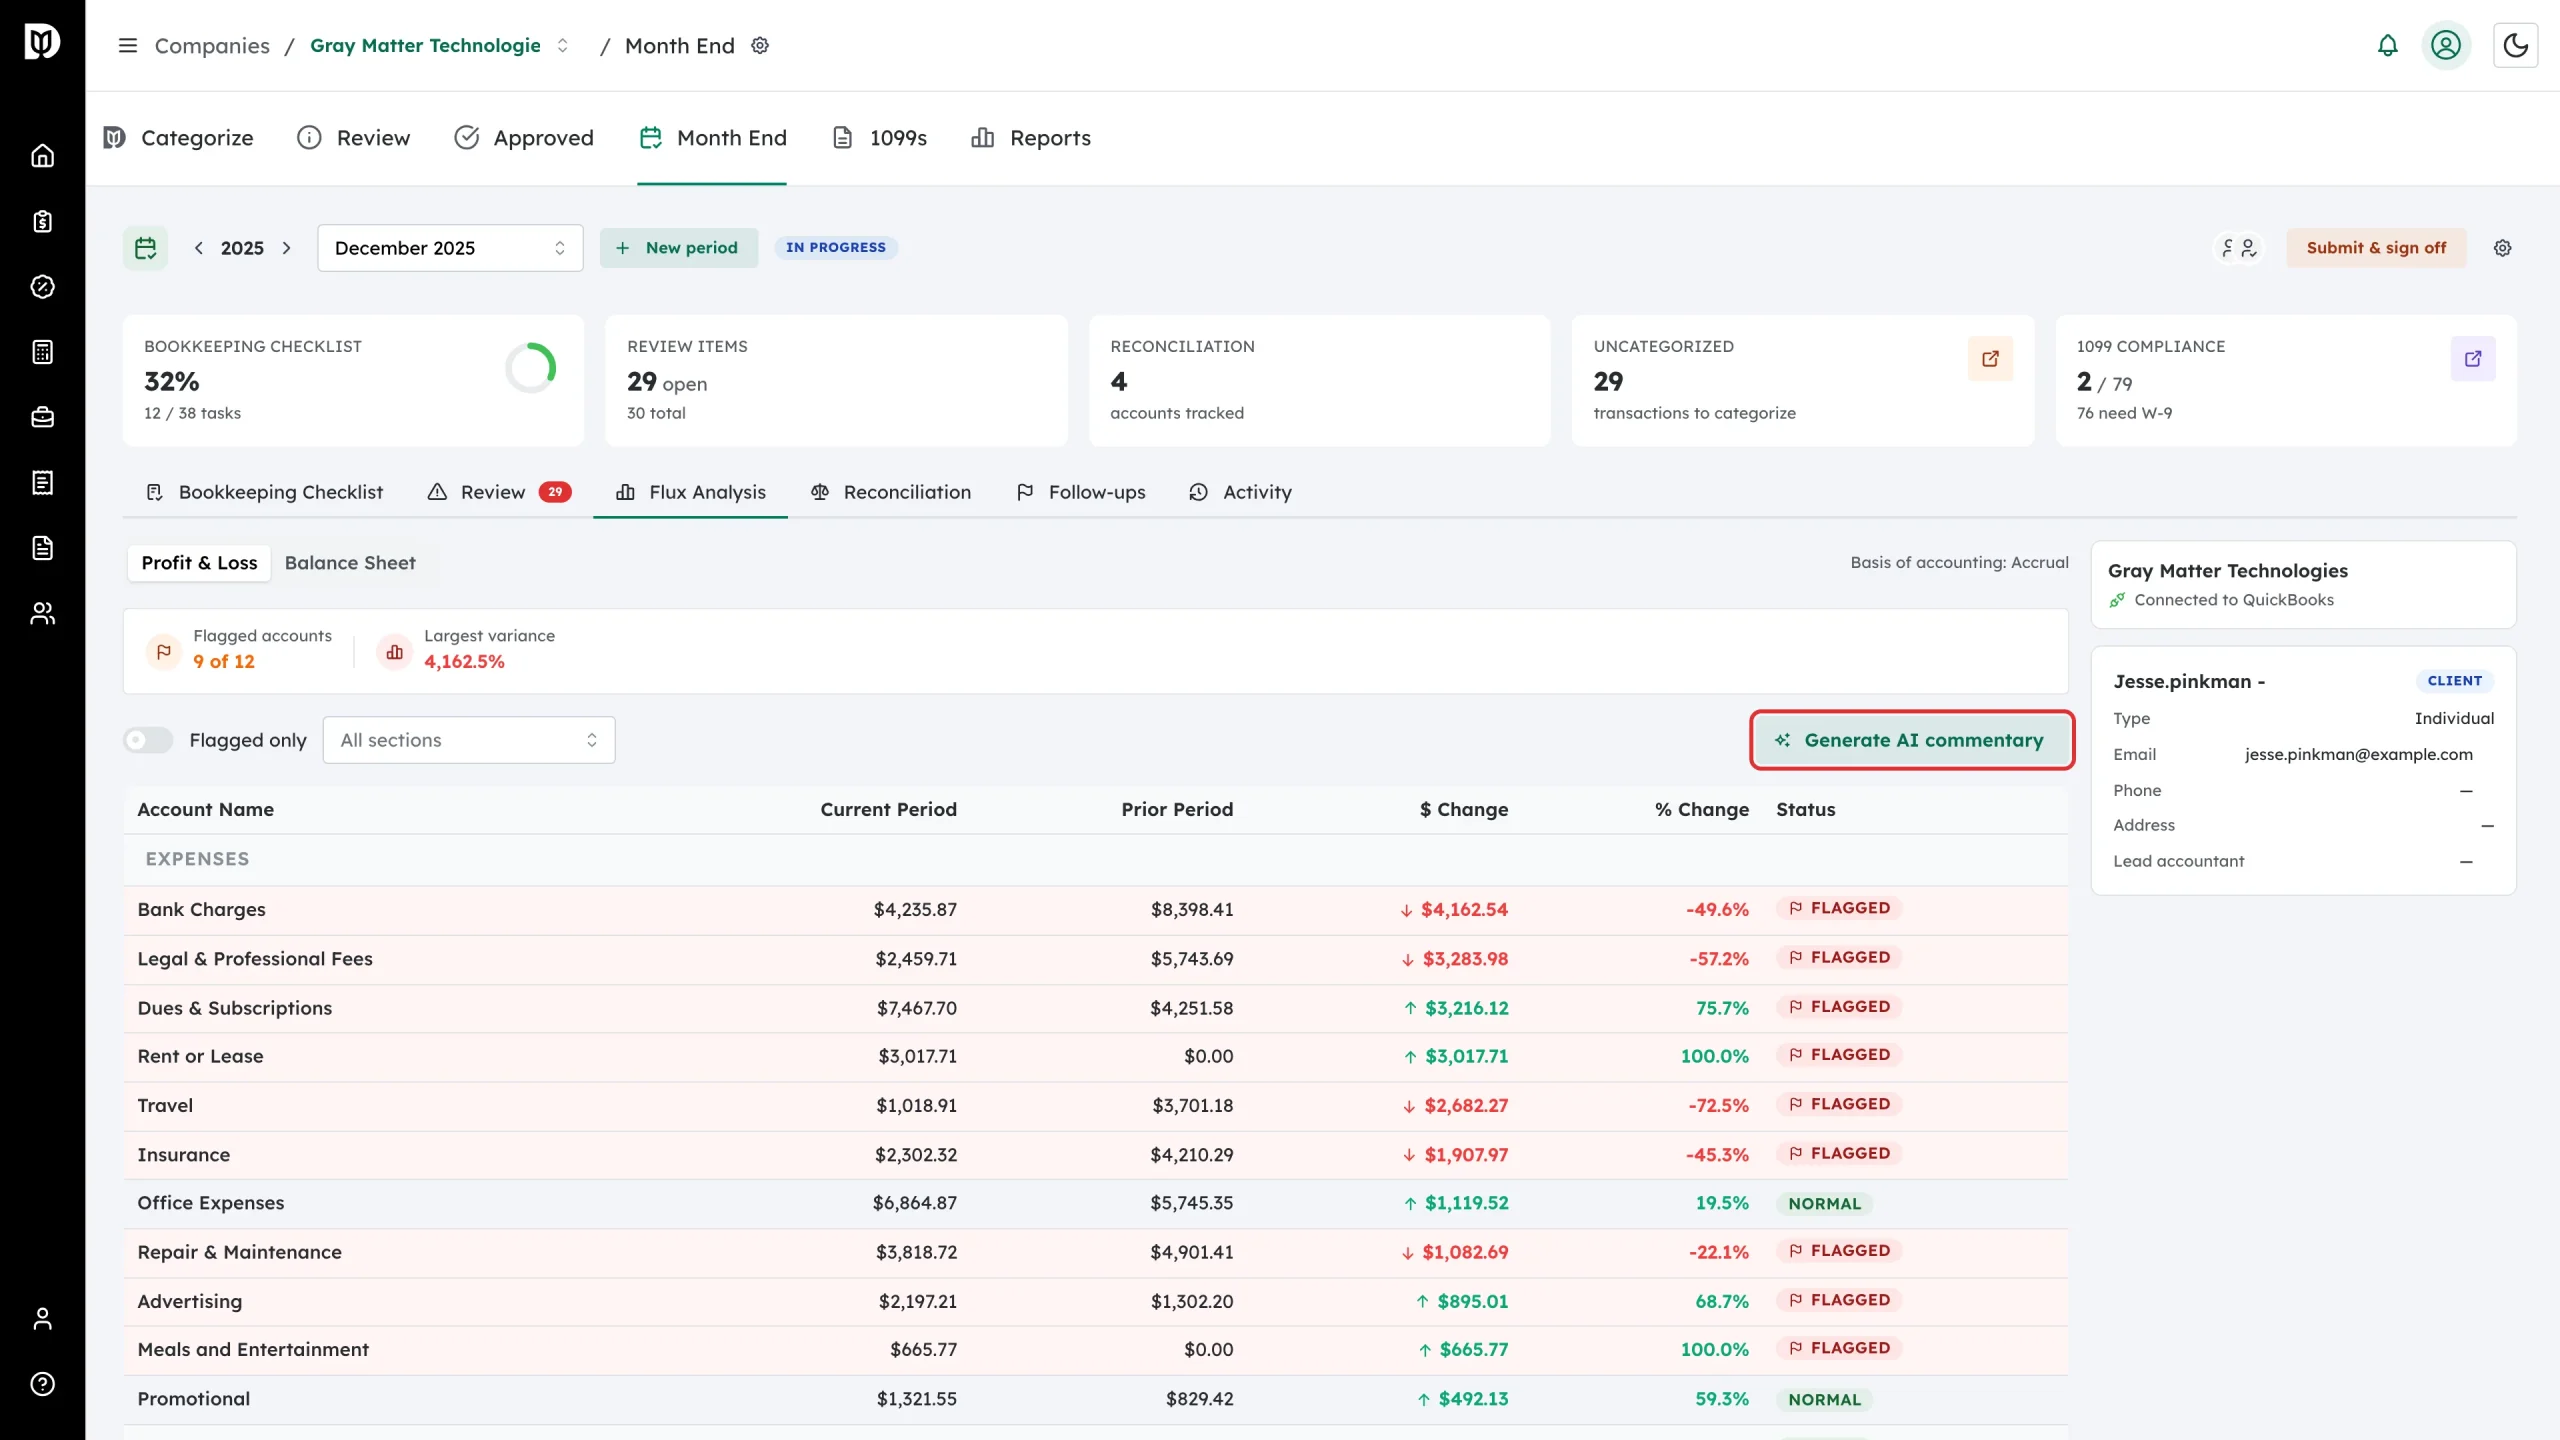
Select Generate AI commentary. Debits drafts an explanation for each flagged account.
-
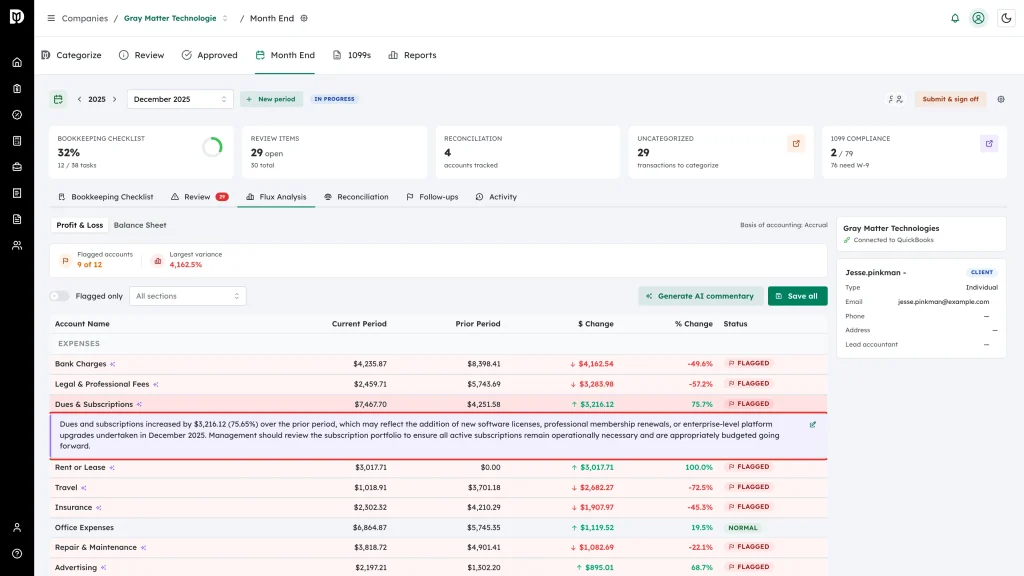
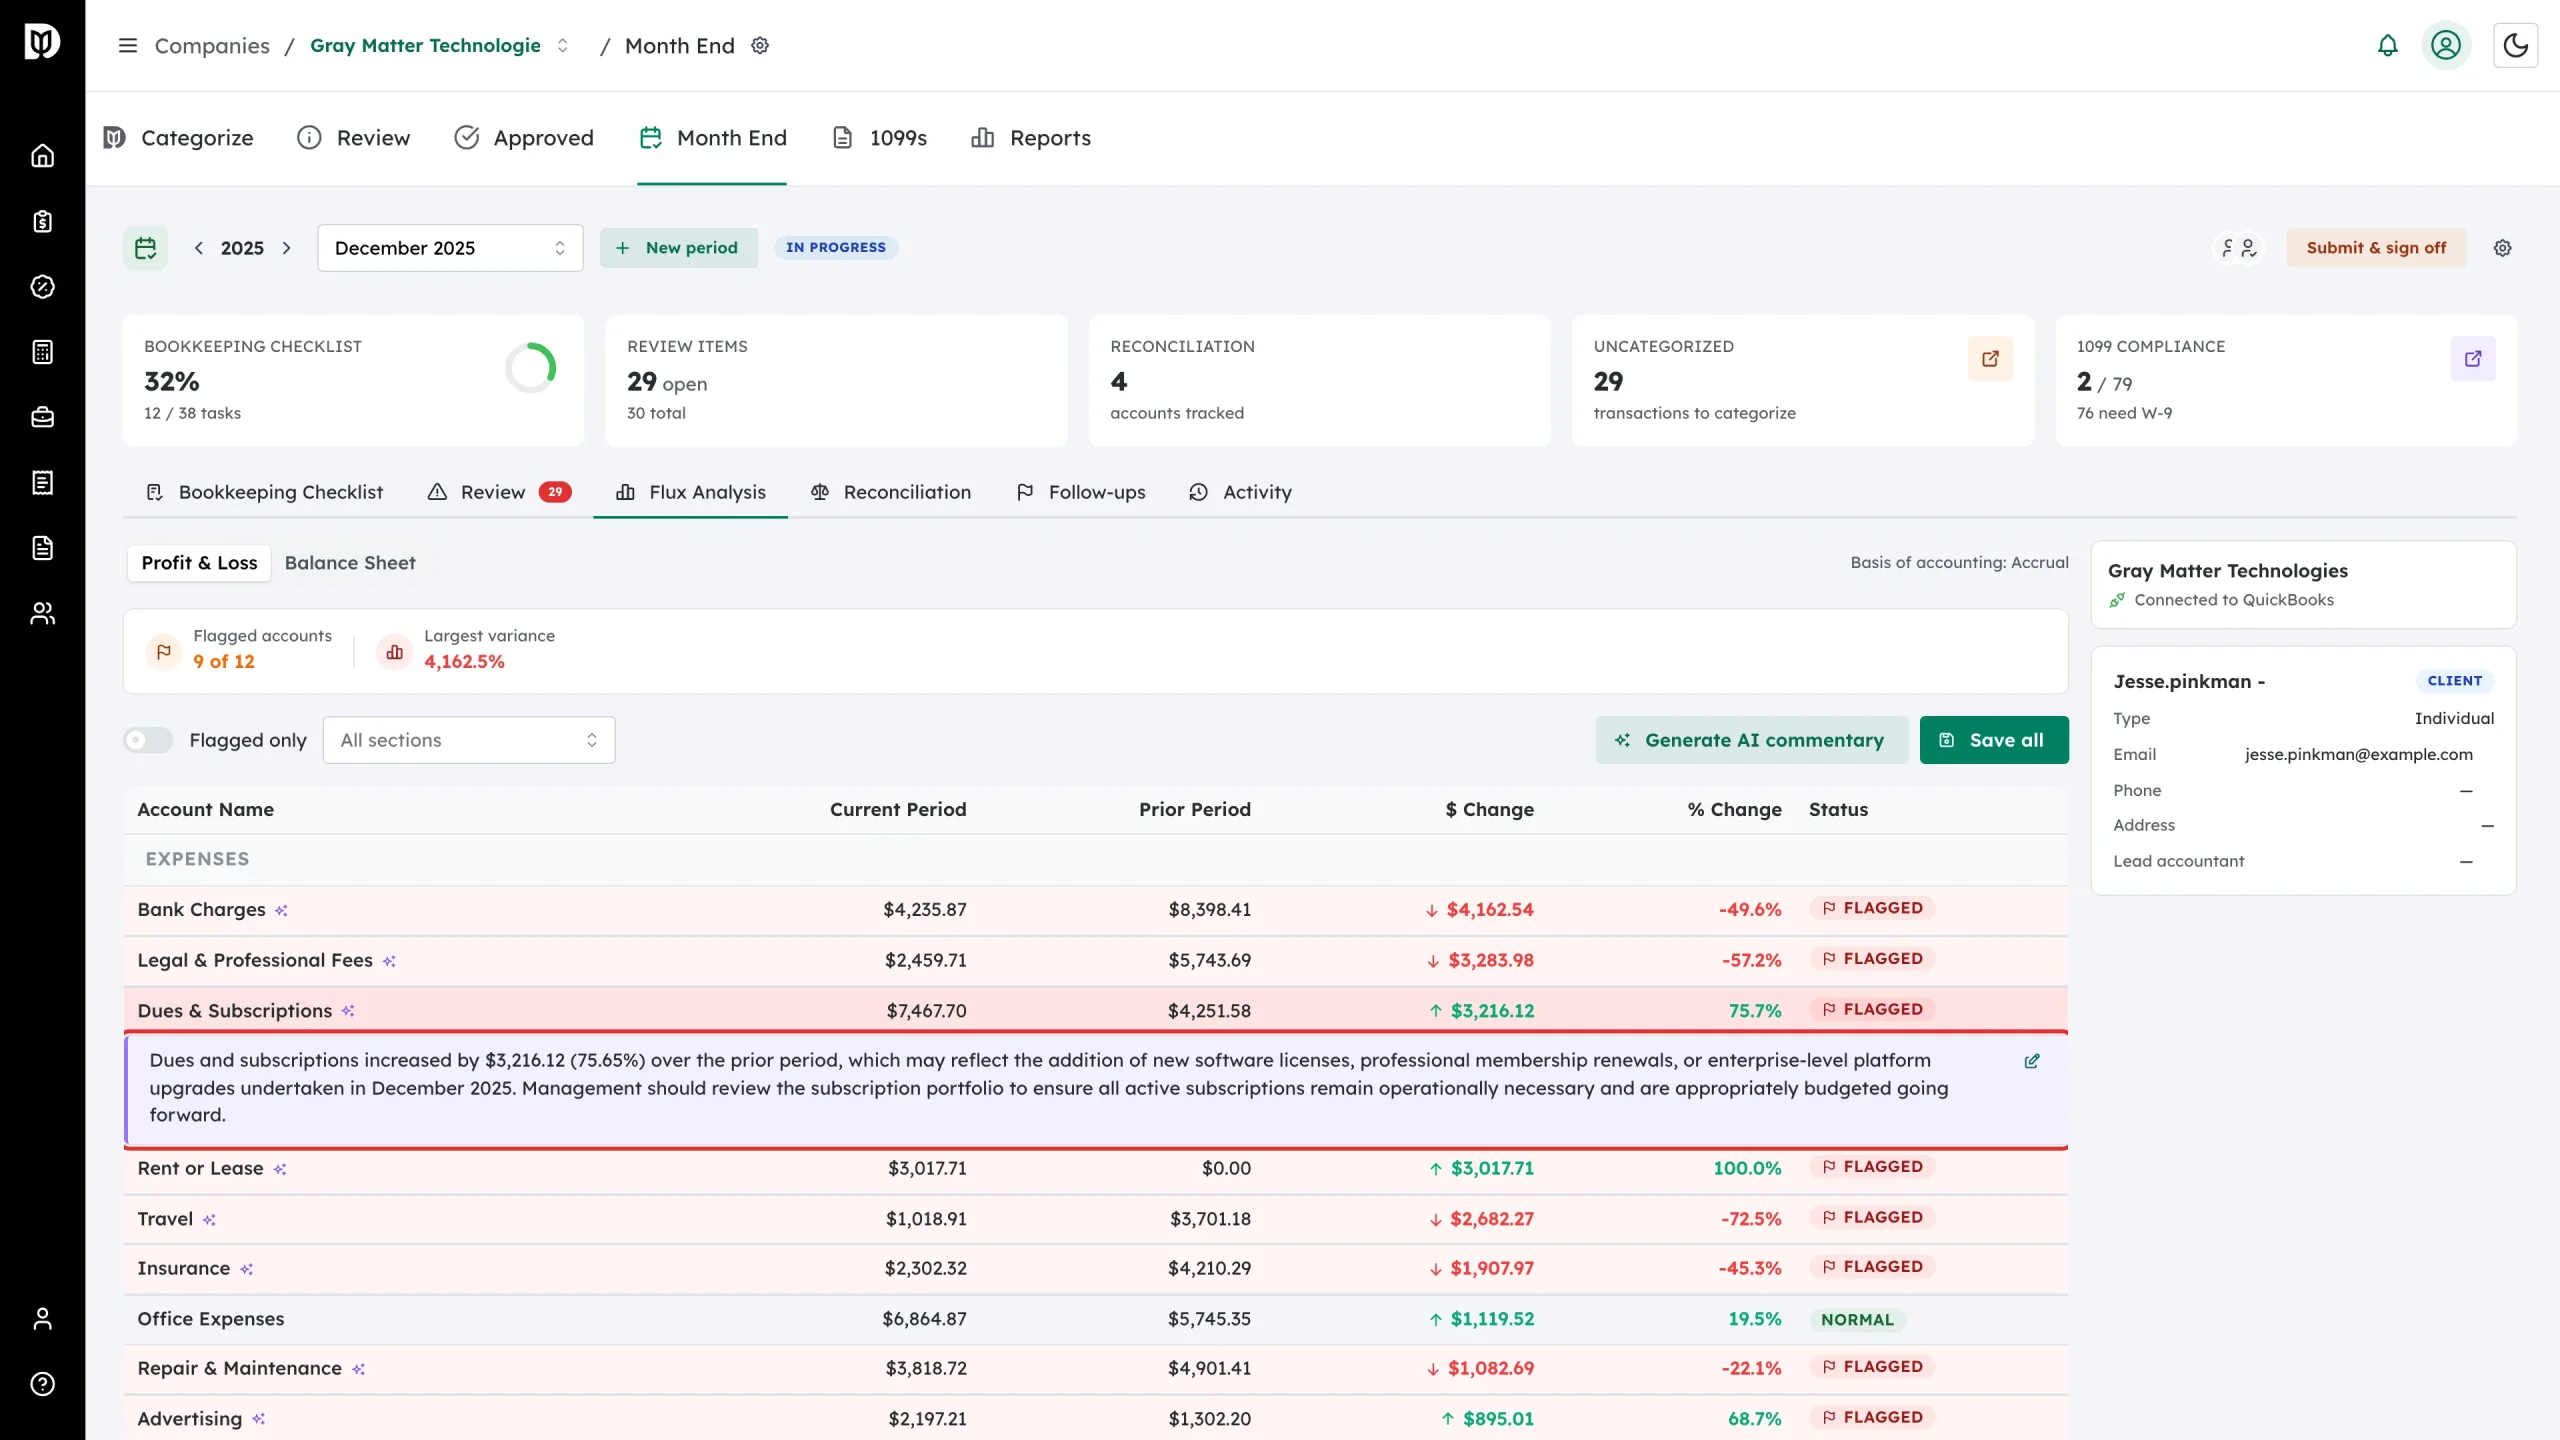
An account with commentary shows a small sparkle next to its name. Select the row to read the draft, and the pencil icon to edit the wording.
-
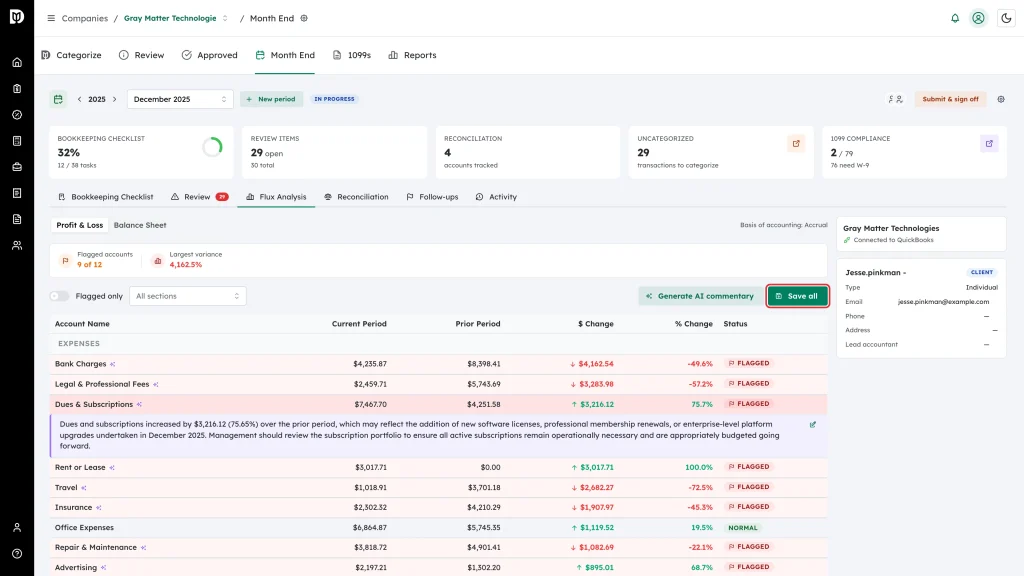
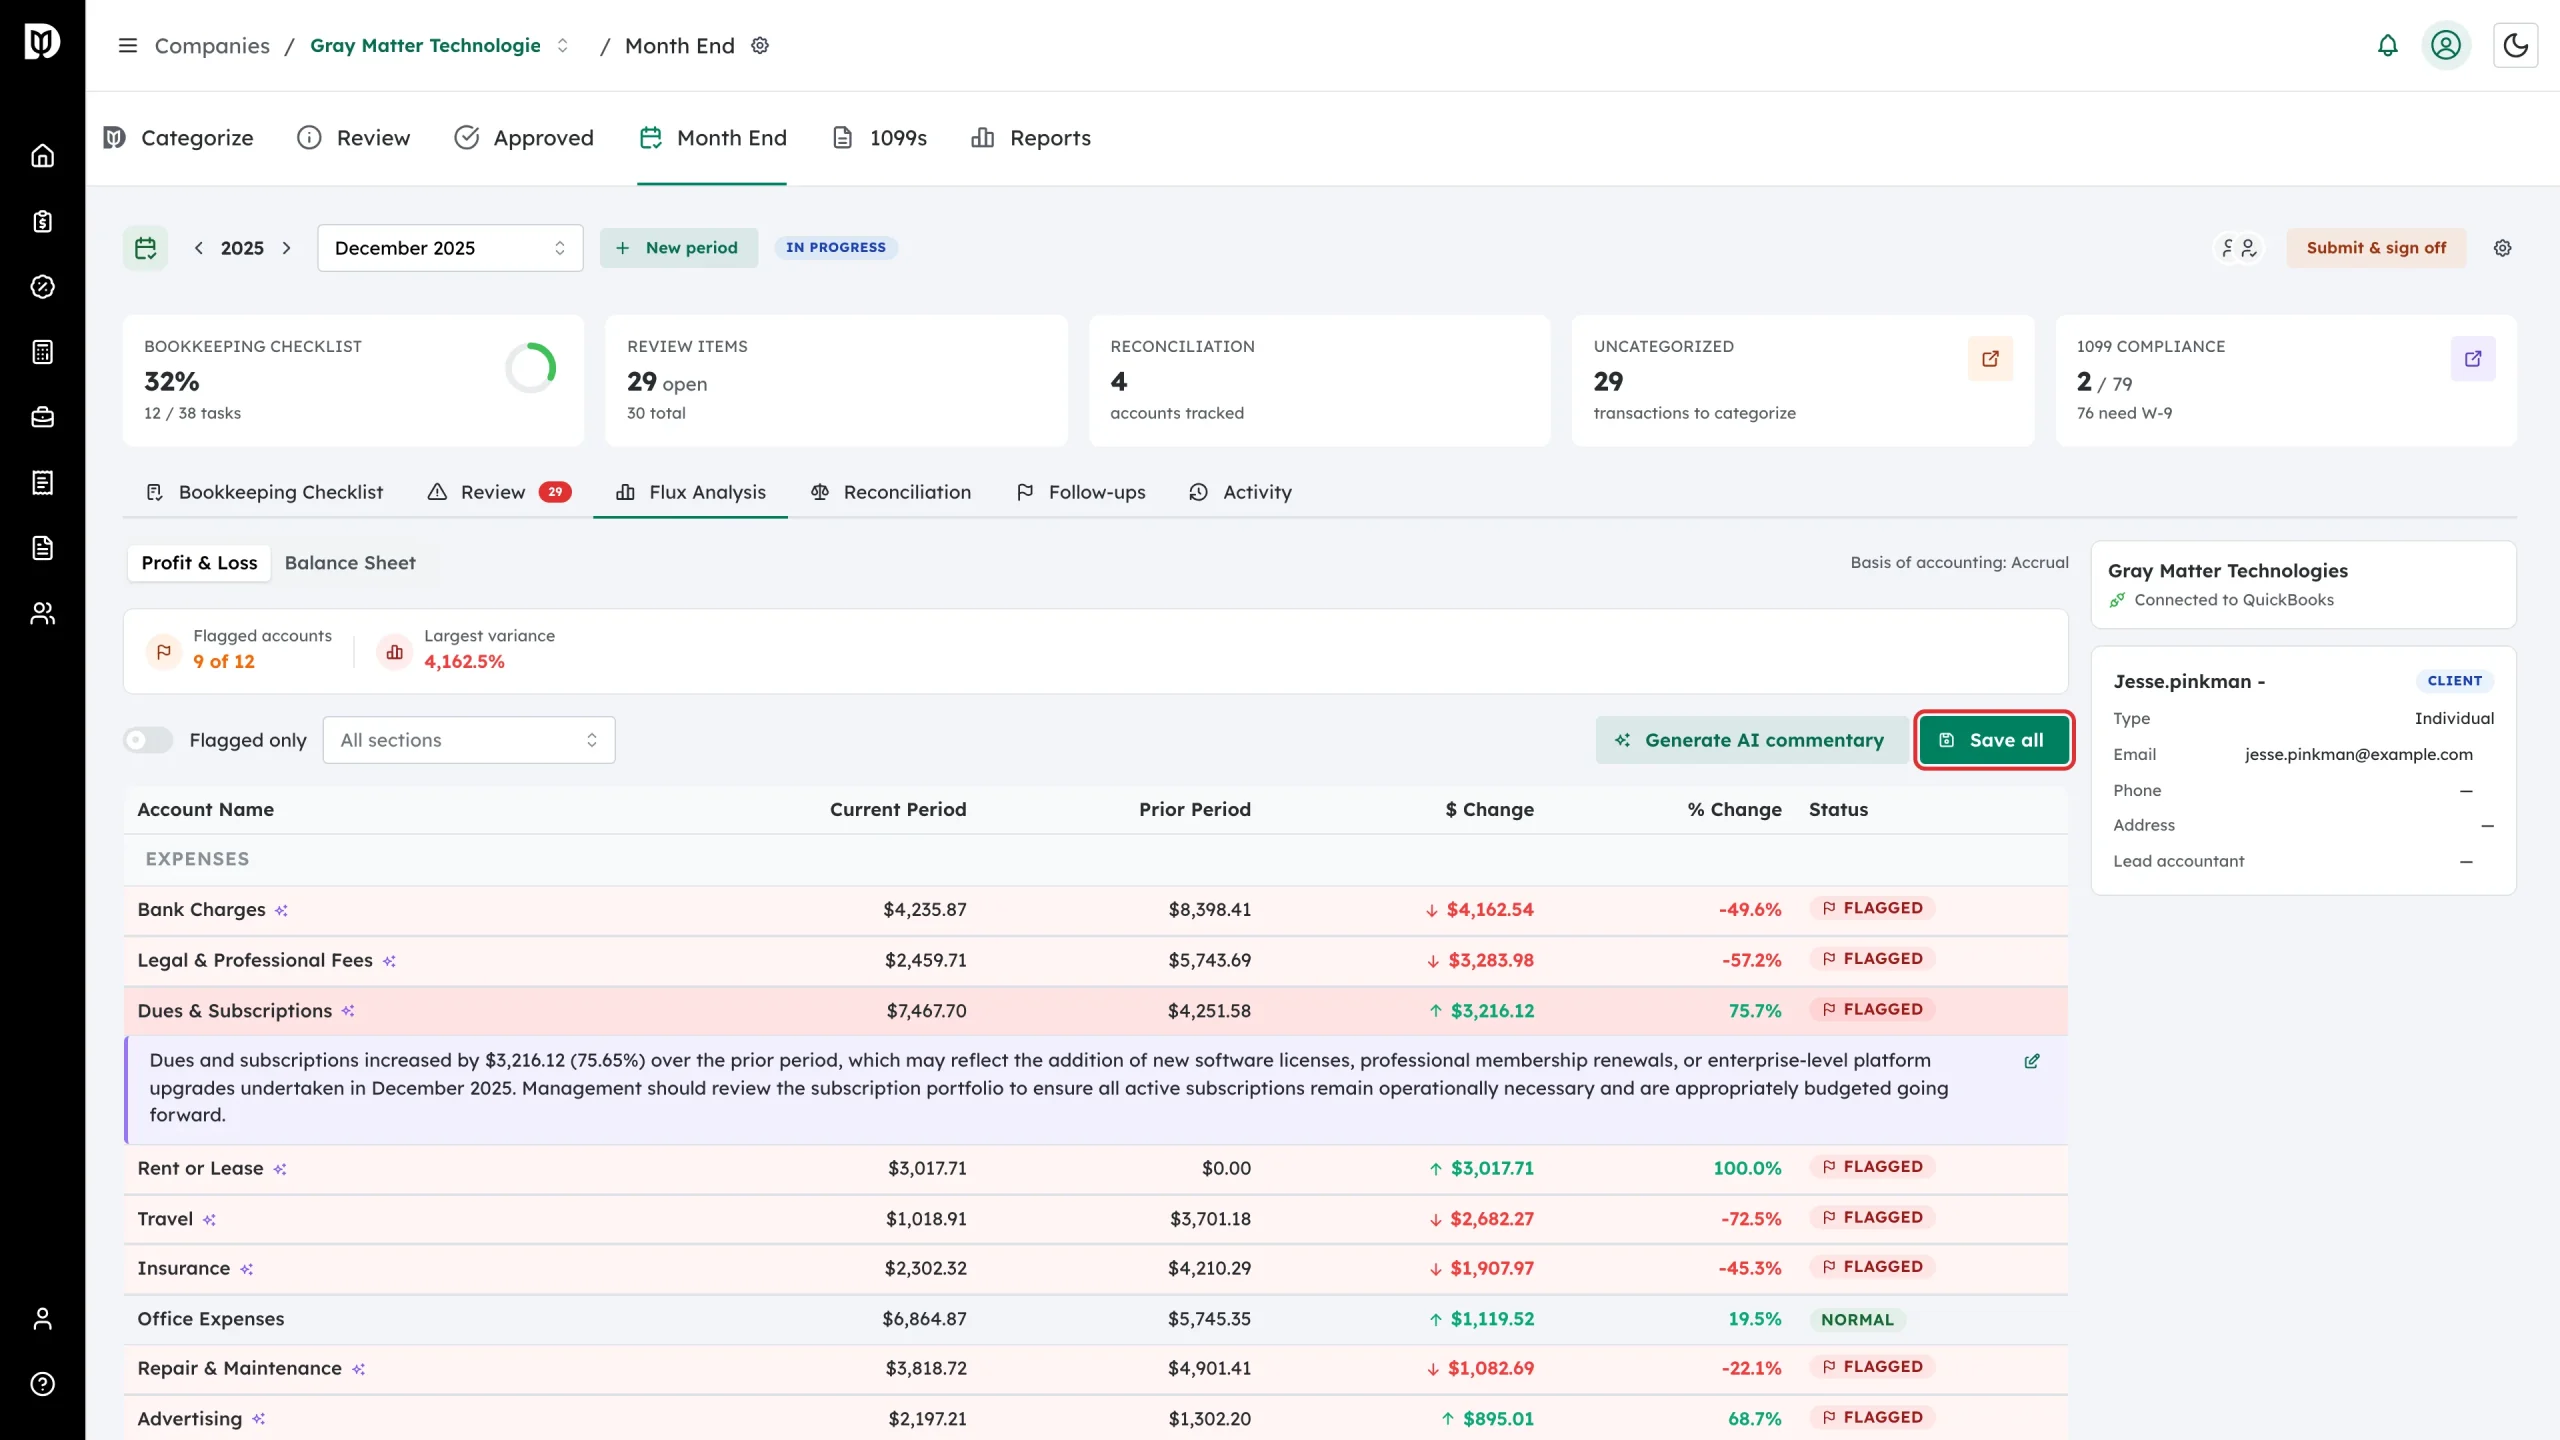
Select Save all to keep the commentary on the close.
What happens next
Saved commentary stays with the period, so the reviewer and anyone reading the close later sees why each account moved. Use it to explain unusual movements before final sign-off.
Troubleshooting
- Your commentary disappeared. Generated drafts are only kept once you select Save all. If you leave the tab or refresh first, they are lost — regenerate and save.
- The table is empty and Generate AI commentary is greyed out. Flux Analysis compares this month against the prior one. There is nothing to compare until QuickBooks returns figures for both, so check the client’s connection and that the months have activity.
- “Failed to load flux analysis”. Select Retry. If it keeps failing, the client’s QuickBooks connection has usually expired.
- The “Largest variance” figure looks odd. It is showing the largest dollar movement formatted with a percent sign. Read the $ Change and % Change columns for the real numbers.